Introduction
Who cares if the digital economy is concentrated? Apparently, lots of people. “Many of the most innovative internet-derived digital markets, such as search engines, social networks, network operating systems, ecommerce, and ride-sharing, are highly concentrated and have been dominated by one or a few firms for a number of years. The lack of entry of competitors in these important markets—despite high profits—suggests either barriers to entry or exclusionary conduct, or both”[1] declares Fiona Scott Morton[2] and her co-authors in a Stigler Center Report. Thomas Philippon argues “competition has declined in most sectors of the U.S. economy, ”[3] paying particular attention to Amazon, Apple, Facebook, and Google as he makes his case, noting that “Information technology (IT) markets are highly concentrated.”[4] Jason Furman and Peter Orszag fret that network effects “create tremendous barriers to entry in areas like online advertising, search, and operating systems for mobile phones and computers,”[5] potentially leading to retarded innovation[6] and increasing inequality.[7]
This academic concern is accompanied by substantial political hand wringing and calls for new approaches to regulating the big players in the digital economy. Toward the end of her campaign for the Democratic nomination for president, Elizabeth Warren wrote that as companies like Amazon, Google, and Facebook “have grown larger and more powerful, they have used their resources and control over the way we use the Internet to squash small businesses and innovation, and substitute their own financial interests for the broader interests of the American people. To restore the balance of power in our democracy, to promote competition, and to ensure that the next generation of technology innovation is as vibrant as the last, it’s time to break up our biggest tech companies.”[8] Around the same time, in an Associated Press interview, Joe Biden also indicated an openness to intervention in the digital economy saying that breaking up large technology companies is “something we should take a really hard look at.”[9] The growing scrutiny of Big Tech’s market power is bipartisan, as indicated by multiple inquiries by state attorneys general across the political spectrum,[10] and even President Donald Trump has hinted his administration might join the fight against these companies. Trump indicated the federal government “should be suing Google and Facebook and all that,” adding, “perhaps we will.”[11]
Those calling for action against the Big Tech companies generally agree that they are too big and that their size yields network externalities that insulate them from competition. In addition to being protected from competitors, both existing and future potential entrants, it is sometimes claimed that there are no real substitutes for the products offered by Big Tech firms, and it is sometimes suggested that the products are near necessities, allowing the firms to exploit consumers without limit. Some critics likewise argue that firms such as Google can use their advantage in their core market to gain market power in ancillary markets,[12] further cementing their dominance and leading to an even broader erosion of consumer welfare.
In addition to claims about the general exploitation of consumers and predictions that entry into digital markets is largely foreclosed by the dominance of companies like Facebook, Amazon, Apple, Netflix, and Google (the so-called FAANG companies), as well as some other villains like Uber and Microsoft, other claimed ills arising from high concentration in Big Tech include reduced innovation,[13] increasing inequality,[14] reduced privacy and security of personal data,[15] and decimated markets for labor[16] and other intermediate goods[17], to say nothing of the demise of democracy itself.[18] Big is bad, the story goes, when it comes to these tech giants, and the primary prescription is more antitrust intervention, including break-ups[19] and direct regulation,[20] as well as adopting new standards to govern antitrust law altogether.[21]
These academic and policy concerns hinge critically on the claim that the relevant markets are highly concentrated.[22] I investigate that claim and argue that many of the stylized concentration facts are misleading. I also provide some analysis suggesting that fears of leveraging supposed market dominance to gain control of related markets may be overblown.
I. Defining Markets Too Narrowly Is Question Begging
Amazon is a behemoth when it comes to online sales. Based on common estimates, Amazon accounted for 37% of retail e-commerce sales in 2019, and it is expected to push 40% by 2021.[23] The next closest competitors (Wal-Mart and eBay) do not even control 5% of e-commerce sales each.[24] However, relegating Amazon’s market to e-commerce rather than retail more generally might be a little like treating Sonic as controlling the market for hamburgers delivered to your car while you sit in a parking lot stall because McDonald’s won’t do that. That is, there is little a priori reason to carve out something known as e-commerce from retail more generally. In fact, data from a 2018 survey suggest that most consumers still prefer shopping offline. When asked, “If you had to choose, which would you say is your preferred method of shopping? . . . In person at a store, online, with items being shipped to you, online, and picking up items at a store,” 55% indicated they preferred to shop in person at a store, and an additional 5% said they preferred to shop online but pick the item up at a store. Of the remaining respondents, 37% said they preferred shopping wholly online.[25] Given this background preference for in-person shopping, treating e-commerce as its own market, as opposed to a substitute to the primary retailing market, may be problematic. The survey data strongly indicate that most shoppers regularly bounce between physical and online retailers.
If U.S. retail sales more generally are taken as the denominator of Amazon’s market share, the company looks a lot less threatening. As seen in Table 1, switching the relevant market to overall retail sales as opposed to e-commerce sales will reduce Amazon’s measured market share significantly.
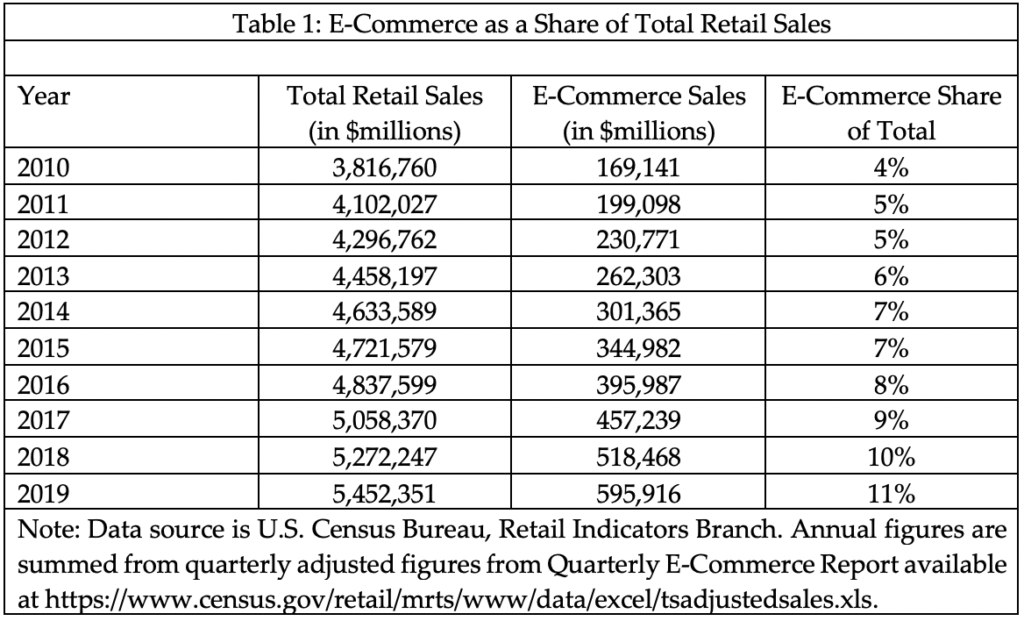
In its financial statements,[26] Amazon does not provide U.S. specific sales numbers. It does break out the North American component of net sales, with North America representing 61% in both 2018 and 2019. Amazon does not provide this geographic breakdown when differentiating net product sales from net service sales (which includes things like Amazon Web Services), but assuming that the breakdown for North America is comparable to that for the company as a whole (i.e., about 60% of total net sales come from net product sales), Amazon’s North American net product sales were about $103 billion in 2019. Since the U.S. net product sales would only be a subset of this North American number, the absolute maximum share of U.S. retail sales accounted for by Amazon’s first party sales is less than 2%.
Third party sales on Amazon’s platform are often included in the conventional estimates of Amazon’s share of e-commerce. It is not clear that these sales should be lumped together for market concentration purposes. If, however, one includes third party sales, the total “Amazon-related” share of total U.S. retail sales is likely well below 5%.[27] As a point of comparison, Walmart’s U.S. net sales of $331,666 million in 2019 represent about a 6% share of total U.S. retail sales,[28] despite lagging behind Amazon in terms of e-commerce share, where Walmart holds about 5%.[29] Interestingly, Amazon’s success in attracting third party sellers to its platform appears to have induced Walmart to enter that market as well.[30]
Perhaps the narrow framing of e-commerce as its own market is the correct one. If consumers buying their retail goods online from Amazon and Walmart are distinct from the consumers who drive to Amazon or Walmart stores (among others) to buy something they want, with little competition across the shopping channels (as well as others such as catalogues or other direct marketing approaches), e-commerce should be treated as a distinct market. However, if changes in one channel (such as price movements, changes in quality provided, service levels, etc.) affect consumer choices in the other channel, it is not valid to act as if Amazon exists independently of brick and mortar retailers. Unfortunately, the academic literature does not provide much in the way of well-identified, rigorous econometric analyses of the degree to which these market channels interact, leaving it as a mostly open question of how much competition Amazon actually faces.
One interesting study, however, might provide some clues about how much competitive discipline Amazon faces. A 2018 paper by Brian Baugh, Itzhak Ben-David, and Hoonsuk Park examined how consumers changed their electronics purchasing behavior when states required Amazon to collect sales taxes on Amazon purchases.[31] First, the authors found that consumers were sensitive to the change, reducing their Amazon purchases, especially for higher priced electronic items. Second, they found substantial substitution toward the second largest online electronics retailer (Newegg) which was not required to collect sales taxes by and large due to its limited legal contacts with jurisdictions outside of California. Perhaps most interestingly, the authors found that “heavy” Amazon users were the most sensitive to this cost change, suggesting that Amazon potentially faces competition even for its highest volume users. This implies that even though Amazon would appear to have a tight hold of the supposed e-commerce-specific market, effective price changes of a few percent lead consumers to switch to other online options. Unfortunately, because the paper only examines electronics products, we are left wondering to what degree there is substitution in other product categories. That said, survey evidence suggests that price is a primary driver of Amazon shoppers. In December 2015, 56% of Amazon users indicated that price is “extremely important” with another 24% saying price was “pretty important” to them.[32]
This paper does not provide much insight into the extent of competitive rivalry between Amazon and physical retailers. The authors only examine potential substitution to a single brick and mortar retailer (Best Buy) and do not find a statistically significant effect. A related paper, while not examining Amazon, does look at the effect of a similar natural experiment involving the reduction of sales tax on some apparel items in New York City and the coincident effect on the online and catalog sales of a specific retailer’s sales to customers in New York City as compared to simultaneous changes to customers in unaffected locales (Connecticut and Massachusetts). That paper found a significant reduction in the retailer’s online and catalogue sales that appears to be causal as New York City shoppers substituted to making purchases at physical stores in the city. Again, although this does not directly tell us about whether Amazon competes with brick and mortar stores, it does hint at the competitive dynamic between physical and online retailers.[33]
Perhaps a similar natural experiment could be examined based on when Amazon introduced same-day delivery in a handful of markets in 2015.[34] Presumably, prior to the availability of same-day delivery, if online and brick and mortar outlets are competitors, one of the reasons a consumer might choose to buy at a physical store is due to impatience. With the introduction of shorter shipping times, the benefit of buying at an actual store is reduced. If non-online retail sales dropped (in relative terms) in markets where Amazon introduced same-day delivery, this would be reasonably strong evidence that online retail outlets and physical retail outlets should be included in the same market. If no such effect is observed, that would be prima facia evidence that the two markets are indeed distinct.[35] Without such evidence, discussing policies to head off Amazon’s supposed monopoly power would seem to be premature at best.
The early 2020 coronavirus experience may present a similar, though potentially more complicated, natural experiment from which we can learn about the contours of what in which Amazon resides. As cities and states adopted stay at home regulations and ordered the closure of physical retail establishments, online retail went largely unaffected. If physical retail sales do not present competitive discipline for Amazon and its online competitors, presumably we should not observe much of a substitution between physical retail sales and online sales. Instead, the physical sales should have largely disappeared altogether. Such a study design would need to account for non-competitive influences impacting online sales, such as expected reductions in income generated by the coronavirus pandemic, as well as exogenous demand shifters (e.g., as individuals bought equipment to transition to work in at-home offices), but these are the kinds of studies that are needed to determine whether e-commerce is its own market; market definition should not be based on intuitive say-so.
On top of these existing (though as yet unknown or at least not rigorously quantified) market dynamics, the extent to which Amazon can exploit consumers and even third party retailers is also potentially limited by entry and expansion in the U.S. market by firms like Alibaba.[36] If consumers are really harmed by Amazon somehow favoring its own products over those of third party sellers, a concern raised by a number of critics that has also generated congressional scrutiny,[37] Alibaba’s model of just providing a sales platform without first party product competition would presumably attract U.S. consumers and third party retailers. Alibaba surely has the technical and financial wherewithal to compete with Amazon if there is a demand for it.
II. Mind Your Ps AND Your Qs
In the book The Great Reversal: How America Gave Up on Free Markets, Thomas Philippon names a chapter “Bad Concentration, Good Concentration” where he suggests that as Walmart gained market share in the 1980s and 1990s, consumers benefited with lower prices. He attributes this decline in retail prices to, among other things, Walmart’s advances in logistics and supply chain management. “The growth of Walmart provides us with an example of efficient concentration. Its profit margins remain stable or even decline, and most important, prices go down. Consumers benefit from Walmart’s expansion. It is fair to debate and challenge Walmart’s labor and management practices, but there is little doubt that Walmart has been good for U.S. consumers.”[38] Philippon uses the Bureau of Economic Analysis’s PCE (Personal Consumption Expenditures) index, which is a price deflator for goods and services purchased by consumers in a given year, relative to the overall consumer price index (CPI) showing that this metric of retail prices was well above the broader CPI from 1960 through the mid-1980s, at which point it declined steadily until about 2005, at which point the ratio flattened.[39] Philippon argues that the period of declining retail prices coincides with Walmart’s increase in retail market share,[40] whereas the flattening portion of the curve matches Amazon’s ascendency: “We have seen that, as Walmart’s market share increased, retail prices decreased sharply. But the improvement stops in 2005. This coincides with the development of online shopping, and in particular with the growth of Amazon.[41]”
Philippon purports to focus on a data driven approach that favors many empirical metrics when examining his argument that firms like Amazon have made markets in the U.S. less competitive and, therefore, have made consumers worse off. As suggested above, Philippon examines prices, as well as profit margins and productivity measures. However, in his Walmart and Amazon (good concentration and bad concentration) example, he ignores one of the best metrics of consumer well-being – consumption. People don’t eat prices; they can’t even hang them on the wall and marvel at them. We care about prices because they affect how much an individual consumes. Further, the prices Philippon examines are only one component of the total price, which includes the cost of acquiring the object (time and effort to go to the store, or the cost of shipping, or the effect of delay, etc.). Ignoring the latter components of total price, while understandable given the lack of systematic data on these aspects, might be misleading. Perhaps it makes more sense to look at how much people are consuming in the various periods of Walmart’s rise and Amazon’s rise.
In Figure 1 below, I use the same PCE index[42] used by Philippon to deflate the retail sales data provided by Census[43] on a per capita basis using Census population data. While Philippon uses 2005 as his “online shopping” break point, the Great Recession (2007-2009) is an obvious confounder. Instead, I break the time series into 1992 (the beginning point for the currently posted retail data from Census) through 2006 and 2010 through 2019.
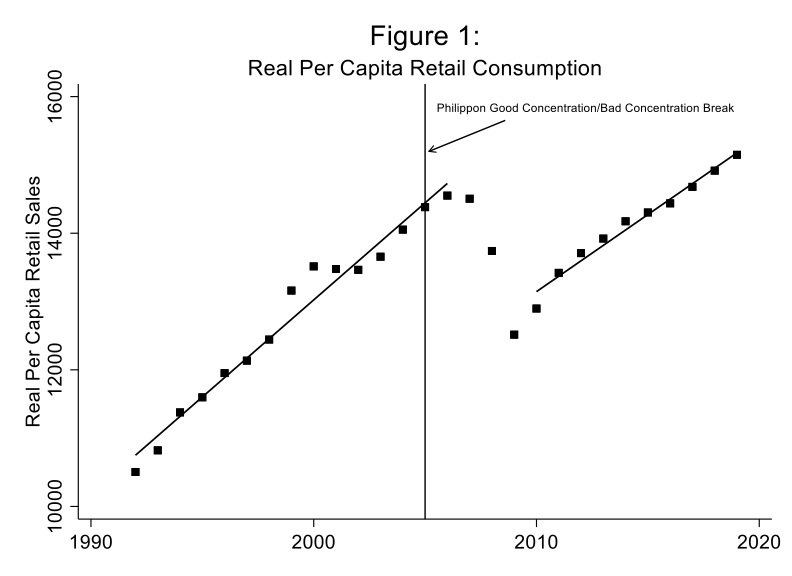
As indicated by the graph, retail consumption is trending at basically a comparable rate[44] in Philippon’s Amazon/online shopping period as it was through the 1990s during the period when Walmart generated increasing concentration in the retail market generally. Based on this metric of consumer well-being, it is hard to declare that Walmart’s concentration was somehow good for consumers, while Amazon’s concentration is somehow bad.
Philippon does suggest that Walmart’s gains went primarily to poor people while Amazon’s accrue to those from a higher socio-economic class, saying “Walmart created more value for lower-income consumers. Amazon is more valuable for upper middle-class households whose disposable income and opportunity cost of time are relatively high.”[45] Such a claim is based on intuition rather than any data. One can easily think of possible counter claims. For example, for poor individuals lacking reliable and convenient transportation, venturing out to do one’s shopping becomes more of a chore than it is for a suburban family loading into its SUV for a Sam’s Club run. Similarly, individuals working an inflexible schedule might find it difficult to get to a store during business hours,[46] whereas a busy white-collar professional might have more control over the particulars of her schedule. On the other hand, the poor may face other impediments to online shopping such as less access to credit cards and less of an ability to secure delivered packages. It is interesting to note, however, given Philippon’s assumption regarding Walmart being more valuable for the poor and Amazon being more valuable for richer people, Amazon has made attempts to increase its services for lower income people.[47]
Rather than speculate, it is useful to explore the data. The Bureau of Labor Statistics has a long-running consumer expenditure survey, which asks people how much they spend on various categories of goods and services. In Figures 2-6, I use the average total reported consumption amount, deflated by Philippon’s PCE index plotted for the same time periods used above for total per capita retail sales, namely 1992-2006 and 2010 through 2018 (the last available year for the Consumer Expenditure Survey) separately for individuals in each income quintile.
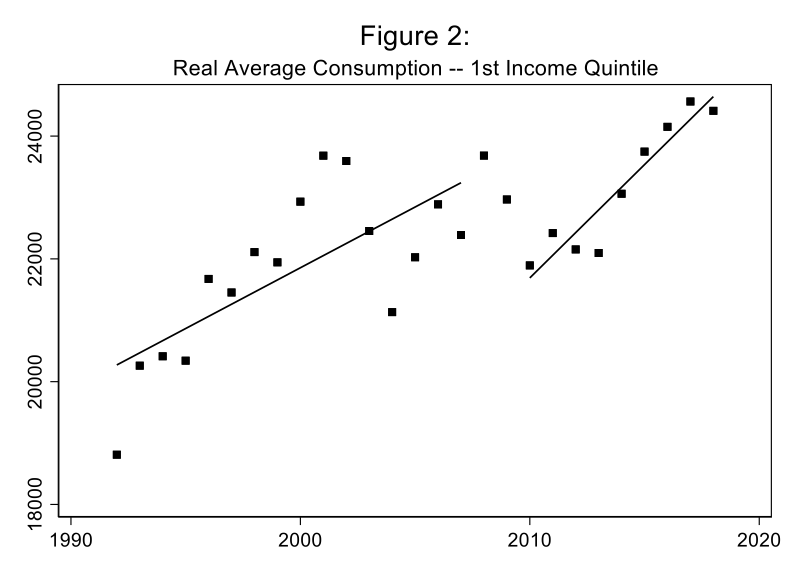
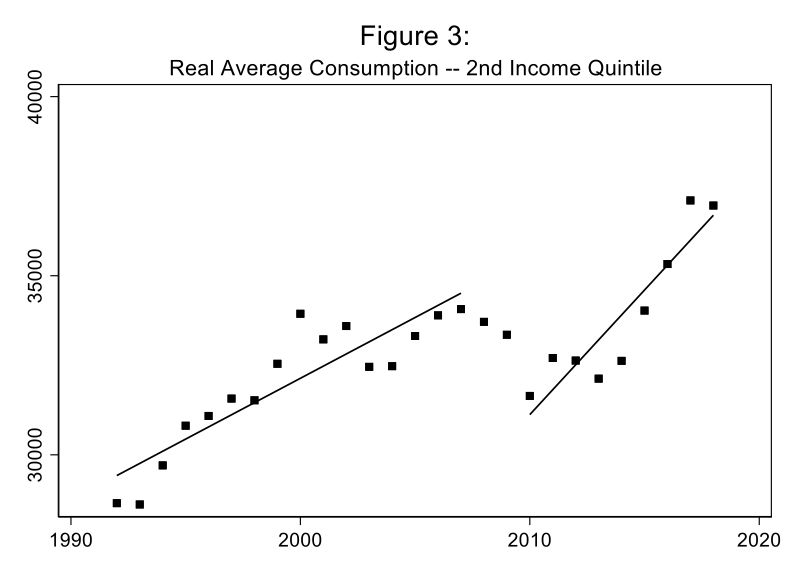
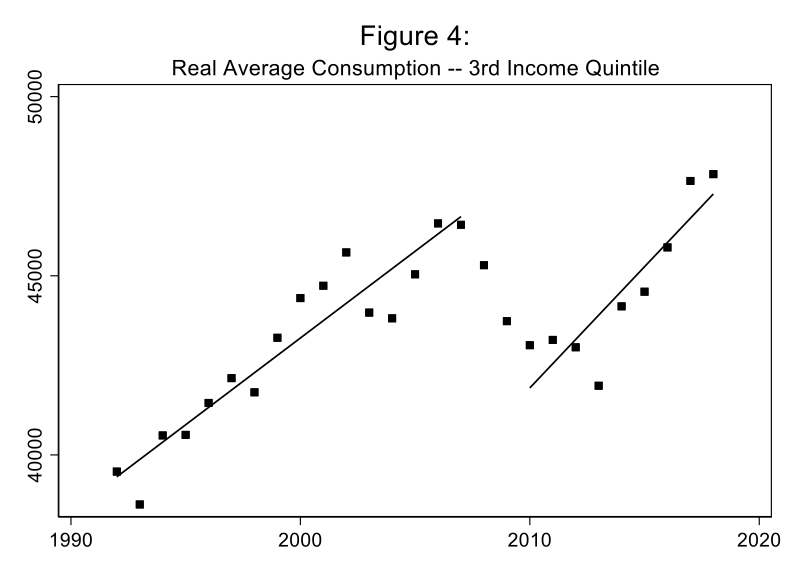
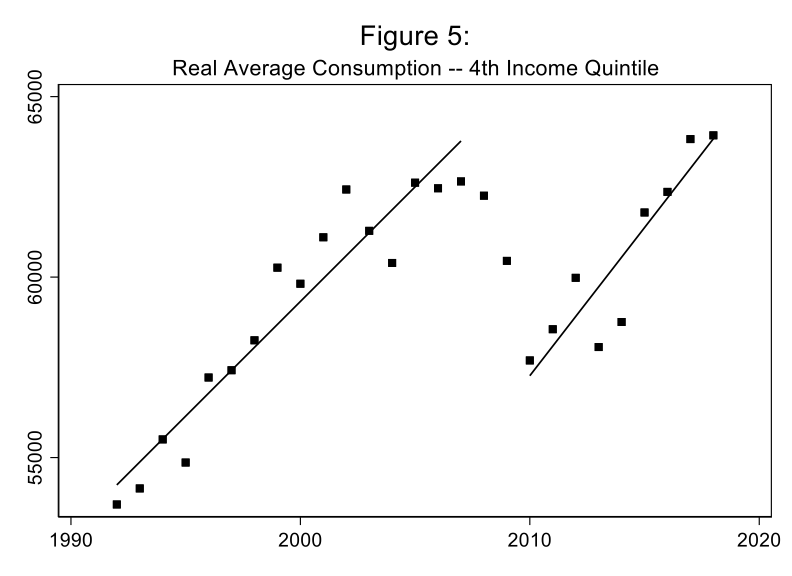
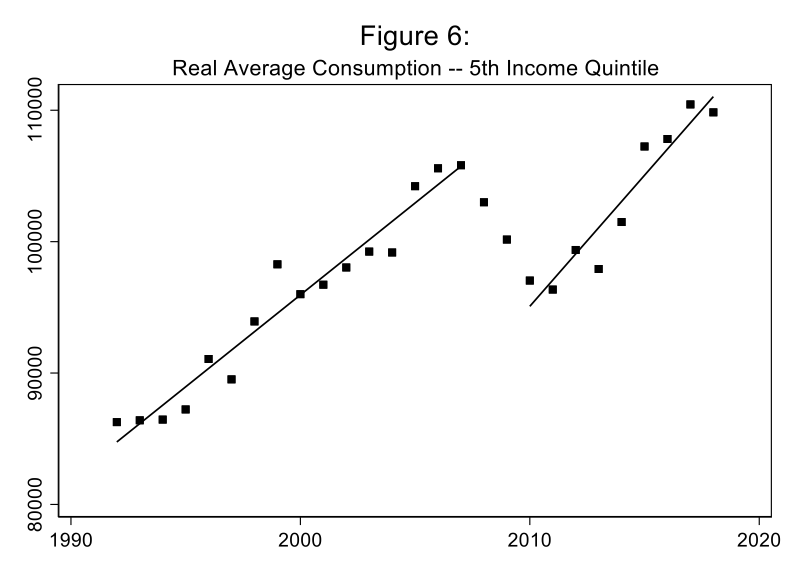
If one were to buy into Philippon’s notion that the 1990s through 2005 or so were the period when Walmart was helping poor people and the 2005 plus period is when Amazon was helping well-off people, the consumption data don’t provide much support. For all income quintiles, both periods, excluding the 2007-2009 Great Recession, represent increasing trends in real consumption. If anything, the first and second quintile folks (i.e., the relatively poor) have seen a steeper growth in Philippon’s Amazon/online shopping period.
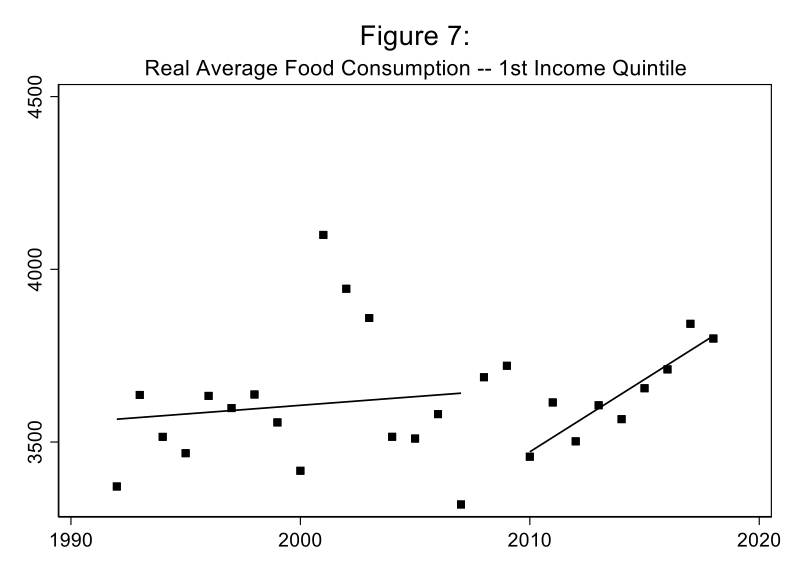
The aggregate consumption numbers may be a bit over-broad for the purposes of focusing on the types of goods Walmart and Amazon sell; to mitigate this concern, in Figures 7-10, I examine the consumption data for only the first income quintile respondents by various categories of consumption to better isolate any possible Walmart/Amazon effects. In each case, I again deflate by the PCE index.[48]
In figure 7, food expenditures are used. In the Amazon period, real food consumption increases at a faster rate than during Philippon’s Walmart period.
For clothing, shown in Figure 8, real consumption among those in the first quintile of income declines at a similar rate in the Amazon period to that observed during the Walmart period.
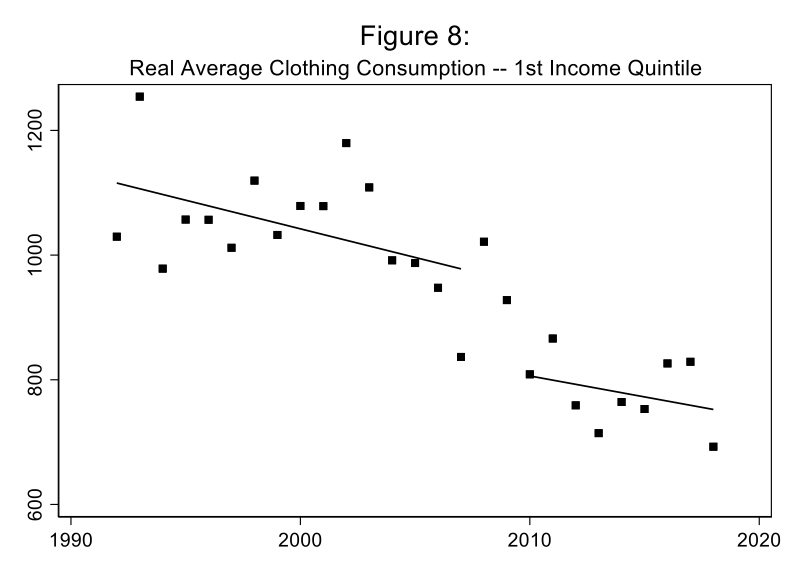
Figure 9 examines real consumption of personal care products among those in the first quintile of income. The upward trend in the Amazon period exceeds that observed in the Walmart period.
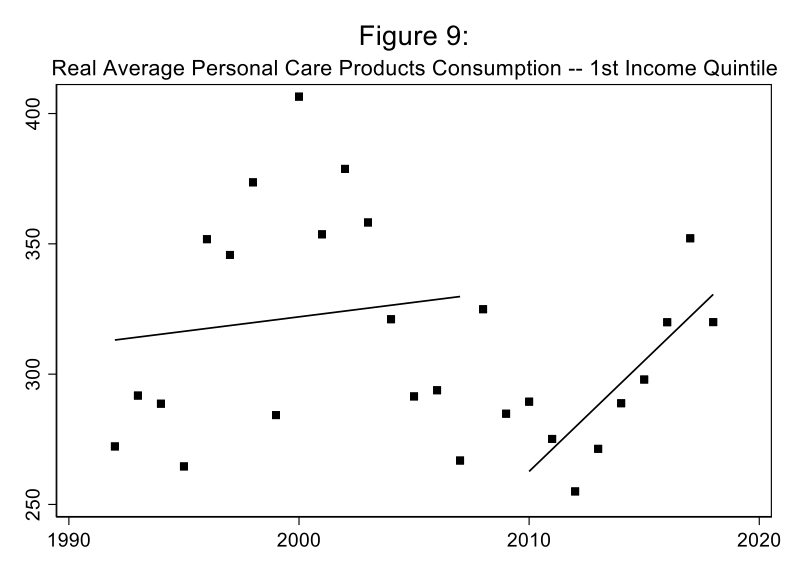
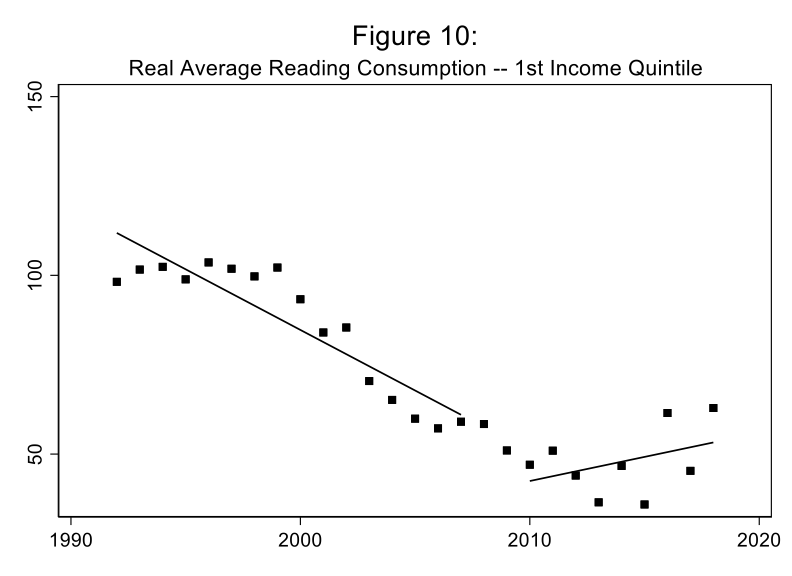
Figure 10 plots deflated expenditures on reading products. In this case, while the reading consumption metric declined steadily in the Walmart period, it rises during Amazon’s ascendency.
By these consumption metrics, with the exception of clothing purchases, it would appear as if the Amazon period has actually been relatively good for those at the bottom of the socio-economic ladder. Consumption, which is central to any notion of consumer welfare, has improved as Amazon has increased its market share. Now I do not make any claim to causality. That is, it is not possible short of better data (used in a design like that suggested above where one examines various shocks to the availability of various Amazon and/or Walmart products and services) to assess whether Amazon or Walmart, through any channel including increasing concentration, has led to, in a causal sense, any of the trends depicted in the figures above.
Likewise, even if we were confident that such a causal relationship existed, it is impossible to know how the mechanism works—is it because of a reduction in prices faced by the poor, is it because the total cost (explicit price plus time and convenience costs) declined, is it because the availability of products was better suited to the tastes of people in this income category, is it because Amazon increases the income of the poor through better jobs or by providing an easier way to sell products (through the Amazon market place), is it some mix of each of these, or something else altogether? The only point made with these data points is that Philippon’s assumption that Amazon only or even primarily benefits the well-off is not obviously true, and there is at least some evidence to suggest it is false.
Philippon continues to focus on price differences when comparing the supposedly worse regulatory environment of the United States to various European exemplars.[49] In the introductory chapter of his book, Philippon uses broadband internet, mobile phones, and plane tickets as illustrative examples of how the United States has done worse than Europe, implying that this is because competition has declined in the United States and this “lack of competition is explained largely by policy choices,”[50] including weaker antitrust enforcement. Although he notes that all proxies for competition are imperfect, and notes particular problems in examining price having to do with taxes and exchange rate comparisons, Philippon sticks to price, profit rates, and market shares as his metrics for indicating the welfare of consumers.
In each of these cases, however, it is easy to imagine aspects of welfare that are poorly proxied by price. A cheaper 25 Mbps broadband connection might be inferior to a gigabit connection, at least for some consumers, and unreliable service at either speed might be shunned for a slower but steadier connection. Mobile phones come bundled with all sorts of services (subsidized streaming subscriptions, hardware rebates, beneficial contract terms, etc.) that may be favored by some consumers even if they lead to higher mobile phone subscription costs. Ryan Air or French Bee might offer lower base ticket prices, but individuals may prefer higher cost options that allow for marginally more pleasant flights.
Once again, price comparisons might not be the best approach when trying to proxy for subjective consumer welfare when products are multi-dimensional and heterogeneous. Although not perfect, examining outcome metrics may shed more light when comparing the attractiveness of regulatory regimes.
With regard to broadband, Philippon notes the higher average monthly cost of broadband in the United States compared to Germany or France in 2017. More recent data (2019) from the same source tells the same story with the average cost (in U.S. dollar terms) of the surveyed broadband packages coming in at $28.74 for Germany, $27.81 for France, with a whopping $50 for the United States.[51] What Philippon does not note, however, is that the story is reversed when the cost per megabit per month is examined with Germany costing $0.50, France at $0.49, and the United States coming in at about half the cost with a per megabit per month cost of $0.26. While these numbers do not tell us conclusively where consumers are “better off,” they do put a wrinkle in Philippon’s story. It might also be interesting to note that, perhaps predictably, U.S. consumers are much more likely to have higher speed broadband plans than either of those European countries. According to OECD data for 2019, while only 11% and 12% of residents in Germany and France respectively have broadband plans with speeds between 100 and 1,000 Mbps, 21% of U.S. residents do.[52] Data on average speed of connection by country in 2017 tell a similar story with the United States notching 19 Mbps, followed by Germany at 15 Mbps, with France bringing up the rear at 11 Mbps.[53] These numbers, however, are only inputs to the ultimate consumption question (which itself is an input, albeit an important one, to the consumer welfare question). One estimate of broadband consumption suggests that the broadband consumption of the average internet user in the United States approaches 2 terabytes annually, whereas Germany and France barely get above 0.5 terabytes per user.[54]
In his analysis of the mobile phone comparison between the United States and France (in a chapter titled “How European Markets Became Free” presumably in contrast to the book’s subtitle “How America Gave Up on Free Markets”), Philippon presents a striking picture where the price of a telecom subscription in France was 10-20% higher than in the United States until 2011, when, as Philippon tells it, Free Mobile obtained a 4G license and “became a significant competitor for the incumbents, making an immediate impact. Until 2011, French consumers paid between €45 and €65 per month for their smart-phone plans, with limited data and a few hours of talk time. Free offered unlimited talk, unlimited SMS and MMS messages, and unlimited data with a speed reduction after 3GB for €20.[55]” By 2014, Philippon notes that France went from having telecom prices that were 15% higher than the United States to 25% cheaper. In terms of explaining the institutional mechanisms behind this reversal, Philippon argues that European regulators are tougher, more independent, and less prone to lobbying than their counterparts in the United States.[56]
As suggested before, however, prices tell only a limited, and potentially misleading story. With my current mobile phone plan, which admittedly costs lots, I have bundled access to at least one streaming service that my kids use, a host of internet tools that allow me to shut off that streaming service and their phones when the kids annoy me, and it includes multiple discounts on replacement phones that I buy for the same annoying kids. How should all of that be factored into adjusting the price of my subscription to compare it with Free Mobile’s plan which, as best as my limited French (which consists of being able to say “hon hon hon” and “Gerard Depardieu”) can tell me, includes no bundled streaming service but does include a better allowance for international calls and might include some kind of phone hardware discount?
A potential way forward, once again, is to look at quantity or usage metrics. A phone plan that provides more value will be used by more people and will be used more intensively on average. That is, higher quantity is a useful proxy for higher consumer welfare. OECD data on mobile broadband subscriptions in 2019 indicates that people in the United States have 149 mobile broadband subscriptions per 100 inhabitants, whereas France has 94 and Germany has 87. Only Finland (155) and Estonia (158) have a higher rate than the United States in Europe, and the only other country in the dataset that exceeds the United States is Japan at 179.[57] At least on the extensive margin, the usage in the United States appears inconsistent with the story painted by Philippon. As for the intensive margin, in a month, a U.S. subscriber uses about 3.1 GB of mobile data. This exceeds the 1.8 GB number for Germany, but it lags the 3.5 volume for France.[58] However, recalling that there are almost 1.5 mobile broadband subscriptions for each inhabitant in the U.S. as compared to 0.94 for France suggests that, on a per person basis, the United States leads France 4.6 GB to 3.3 GB.[59] In either case, the usage metrics point in a different direction than Philippon’s price comparison.
As for Philippon’s last example, airlines, while not part of the digital economy, a similar critique of Philippon’s analysis can be made. Philippon notes a large increase in the concentration of the U.S. airline industry between 2010 and 2020[60] and also includes a direct comparison of prices and profitability of the U.S. industry with the European market. He writes, “airlines are probably among the worst offenders. The Economist noted in 2017, ‘Airlines in North America posted a profit of $22.40 per passenger last year; in Europe the figure was $7.84 [footnote omitted].’ Around 2010, the net profit per passenger was similar in both regions, but since then, prices have increased more in the United States than in Europe.[61]”
Illuminating price metrics are perhaps most elusive in the airline industry. Are bags bundled in the price? How about beer and pretzels? How many miles do I get for the flight and what can I trade them in for? What are the flight change rules? Can I watch the newest superhero movie or am I stuck with a half filled in Sudoku grid to pass the time? The variables that require adjustments in coming up with a sensible price comparison are many and life is short. Luckily, as in the previous analyses, we can look to quantity metrics as a kind of catch all proxy. Despite being so expensive according to Philippon, the U.S. domestic market is the largest single market in terms of air travel passengers as of 2018, with almost 600 million passengers.[62] In terms of total passengers flown, both domestically and internationally, the United States again leads the world with almost 800 million,[63] as compared to France with 140 million and Germany with 171 million.[64] These counts are not perfect quantity metrics to the extent that there presumably needs to be some control for population, though the punchline does not change on a per capita basis with the United States coming in at 2.4 passengers per person, with France and Germany’s measure at around 2.1. Beyond the population normalization issue, these passenger counts, and miles flown data lump together flights by foreign airlines in the United States and U.S. airlines in other countries. That said, in terms of both measures, four of the top five airlines are U.S. firms.[65] While there is no ideal quantity measure for this market, it is perhaps surprising that so much flying is done with airlines that Philippon suggests are so expensive in relative terms.
As a general matter, quantity indicators are at least as important as price metrics when making inferences about consumer welfare, and for a number of reasons, quantity might be superior to price when it comes to judging the competitiveness of a market. Adjustments for quality, convenience, selection, and a host of other factors are necessary when judging consumer welfare effects based on price, but these adjustments are always difficult and are often not possible, especially when subjective valuation is taken seriously. Quantity metrics, on the other hand, effectively have these adjustments already baked in. Of course, when making causal inferences about the effect of some public policy decision or firm choice on quantity, it is necessary to control for other shifters of supply and demand in a rigorous way, but the same is true when examining price. At a minimum, price should not be used to the exclusion of quantity when making claims about what is good for consumers.
III. Great Googley Moogly
Many of the earlier issues can be raised with respect to the concentration claims about Google, especially in terms of what is the relevant market. After briefly examining that issue, I consider the claim that Google can leverage its power in the search market to gain uncompetitive advantages in related markets.
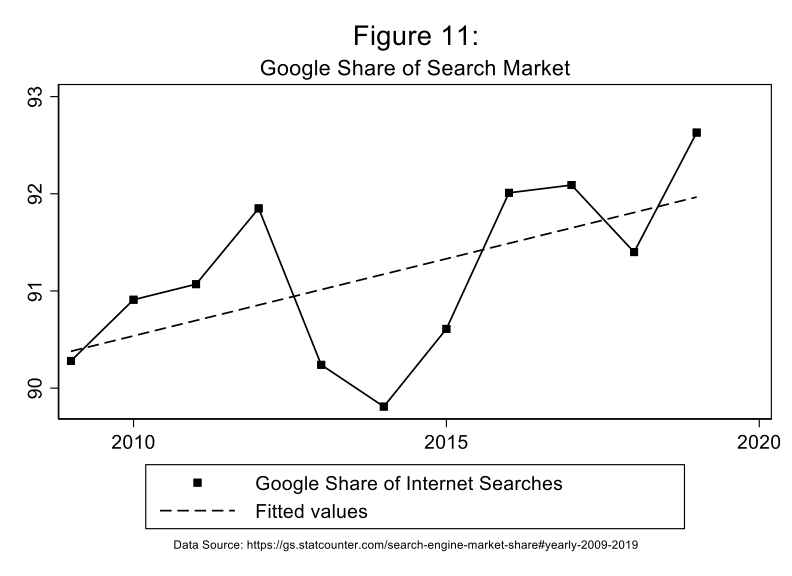
It is generally assumed that Google has a massive advantage in the internet search market. By most counts, Google accounts for something like 90% of internet searches if not more.[66] Google’s number in the United States might be as high as 95%. The next three most popular search engines, Bing, Yahoo!, and Baidu might make up a total of 5% of the worldwide market. As imposing as those numbers are, as shown in Figure 11, Google’s share is actually on an upward trend over the last decade, though, presumably, such a trend cannot go on forever.
All of that said, it is worth considering whether other forms of information search online should actually be included in the discussion of Google’s dominance. For example, in a 2018 poll, when asked where they start shopping online, two-thirds of respondents said something other than “a search engine such as Google,” with 44% indicating they started with Amazon, 10% saying they start with a specific retailer’s website, 6% indicating a product brand’s website, and 5% starting with a non-Amazon online market place like eBay.[67] When shoppers have a specific product in mind, they appear to be even less likely to start their search on Google.[68]
Searching for information outside of the search engine framework appears to extend beyond shopping as well. When asked about where they get information about political candidates, less than half of respondents in a 2018 poll said they used a search engine such as Google, mentioning social media sites more often, and including a sizable dose of other online sources such as newspaper, television and radio station, and magazine websites, as well as blogs.[69] A 2018 poll likewise found Google search lagging behind other online sources when people were looking for information about breaking news, with only 15% of respondents mentioning a search engine.[70] Further, the standard search engine market share numbers ignore peoples use of other websites and applications to search for information (e.g., Yelp, Wikipedia, etc.). All in all though, even with these adjustments, Google would likely continue to have a formidable lead in the way people search electronic sources for information.
Among the more important concerns raised about Google’s dominant position in search is whether it can leverage that position to gain advantages in other markets. Clearly, this concern was raised in the European Commission’s Google Shopping case which resulted in a €2.4 billion fine[71] and is also central in the EC’s Google AdSense case which resulted in a €1.49 billion fine.[72] Rather than re-litigate those cases, which would involve much more than a book chapter allows, I raise the question of why. Why, with its search dominance and its feared ability to extend its reach in related markets, why has Google not done so in some pretty obvious instances where it should have if it could have?
Perhaps the most salient in the midst of the 2020 coronavirus epidemic, when everyone has retreated to working remotely, meeting, teaching, and learning through videoconferencing programs, why didn’t Google get a stranglehold on a market that will surely only grow in coming years. Despite already being integrated in Gmail and Google Calendar—and given how suddenly huge numbers of people were sent scrambling for information on which video-conferencing programs to use on short notice—Google Meet (formerly Google Hangouts) has barely made a dent in the videoconferencing market. By one measure, Google Meet/Hangouts has about 1% of the videoconferencing market, badly trailing Zoom, GoToWebinar, and Cisco Webex.[73] The shift to videoconferencing should have been a layup for Google if its critics are right that it can leverage its search position to take over other profitable markets, and, yet, Google Meet has gone nowhere.
Conclusion
Concentration in the digital economy in the United States has sparked loud criticism and spurred calls for wide-ranging reforms. These reforms include everything from increased enforcement of existing antitrust laws, such as challenging more mergers and breaking up firms, to an abandonment of the consumer welfare standard.[74] Critics cite corruption[75] and more systemic public choice problems,[76] while others invoke the populist origins of antitrust to slay the digital Goliaths.[77] On the other side, there is skepticism regarding these arguments.[78] This chapter continues much of that skepticism.
Footnotes
* University of Pennsylvania Law School and Erasmus University Rotterdam.
[1] George J. Stigler Ctr. for the Study of the Econ. & the State, Comm. for the Study of Dig. Platforms, Market Structure and Antitrust Subcomm., Report 11 (2019) [hereinafter Stigler Ctr. Report], https://research.chicagobooth.edu/-/media/research/stigler/pdfs/market-structure-report.pdf.
[2] Elsewhere, Fiona Scott Morton notes that concentration measures are likely unhelpful in assessing competition and ultimate consumer welfare, instead preferring indicators such as price mark-ups (while noting that they too along with other accounting signals of reduced competition bear a complex relationship with consumer welfare and generally involve measurement difficulties). See Steven Berry, Martin Gaynor & Fiona Scott Morton, Do Increasing Markups Matter? Lessons from Empirical Industrial Organization, 33 J. Econ. Persps. 44 (2019).
[3] Thomas Philippon, The Great Reversal: How America Gave Up on Free Markets 9 (2019).
[4] Id. at 265.
[5] Jason Furman & Peter Orszag, Slower Productivity and Higher Inequality: Are They Related? 11-12 (Peterson Inst. for Int’l Econ., Working Paper No. 18-4, 2018), https://www.piie.com/system/files/documents/wp18-4.pdf.
[6] The relationship between competition and innovation in general has long been and will continue to be debated. Innovation as an outcome is not particularly well-suited for rigorous empirical study given the uncertain time lags between investments in the inputs to innovation and the fruits of those investments. Relying on interesting lab experiments to side-step these empirical problems (at the potential cost of losing external validity), Philippe Aghion, Stefan Bechtold, Lea Cassar & Holger Herz, The Causal Effects of Competition on Innovation: Experimental Evidence, 34 J. Law, Econ. & Org. 162 (2018) shows that the links between competition and innovation are complicated even in the contrived experimental setting. Further highlighting the complicated nature of innovation, the Stigler Center report referenced above distinguishes between disruptive innovation and innovations made by incumbents, implying that the former type is better for consumers without much evidence. Stigler Ctr. Report, supra note 1, at 54.
[7] Furman and Orszag use increasing concentration as an indicator of reduced competition, as do many individuals in this literature. However, as argued by Autor, et al., The Fall of the Labor Share and the Rise of Superstar Firms, 135 Q.J. Econ., 645, 702-04 (2020), increased concentration can be a result of increasing competition that leads to a rise in inequality. Others dispute the supposed empirical regularity that concentration is rising, suggesting that more appropriate micro analyses of consumer markets do not support this assumption. See, e.g., Esteban Rossi-Hansberg, Pierre-Daniel Sarte & Nicholas Trachter, Diverging Trends in National and Local Concentration, at 4, in 35 NBER Macroeconomics Annual 2020 (Martin Eichenbaum & Erik Hurst eds., forthcoming 2020).
[8] Elizabeth Warren, Here’s How We Can Break up Big Tech, Medium (Mar. 8, 2019), https://medium.
com/@teamwarren/heres-how-we-can-break-up-big-tech-9ad9e0da324c.
[9] Hunter Woodall, 2020 Hopeful Biden Says He’s Open to Breaking up Facebook, Associated Press (May 13, 2019), https://apnews.com/71c998ad3b39486ca1dcc220201b68b0.
[10] See, e.g., Steve Lohr, New Google and Facebook Inquiries Show Big Tech Scrutiny Is Rare Bipartisan Act, N.Y Times (Sept. 6, 2019), https://www.nytimes.com/2019/09/06/technology/attorney-generals-tech-antitrust-investigation.html.
[11] Tony Romm, Trump Signals U.S. Government ‘Should Be Suing Google and Facebook’, Wash. Post (June 26, 2019), https://nyti.ms/3gWU728.
[12] See, e.g., Benjamin Edelman, Does Google Leverage Market Power Through Tying and Bundling, 11 J. Competition L. & Econ., 365 (2015). For an even more pointed direct attack, see Fiona M. Scott Morton & David C. Dinielli, Roadmap for a Monopolization Case Against Google Regarding the Search Market (Omidyar Network Working Paper 2020), https://www.omidyar.com/sites/default/files/Roadmap%20for%20a
%20Monopolization%20Case%20Against%20Google%20Regarding%20the%20Search%20Market.pdf.
[13] See, e.g., Teresa Rivas, Breaking Up Amazon, Apple, and Facebook Could Drive More Innovation, Analyst Says, Barron’s (June 19, 2019), https://www.barrons.com/articles/breaking-up-apple-facebook-amazon-google-innovation-51560955244.
[14] See Shi-Ling Hsu, Antitrust and Inequality: The Problem of Super Firms, 63 Antitrust Bull. 104 (2018) for a review of some of these arguments.
[15] See, e.g., Dina Srinivasan, Why Privacy Is an Antitrust Issue, N.Y. Times (May 28, 2019), https://nyti.ms/35avyfG.
[16] See, e.g., Karen Weise & David McCabe, Unions Push F.T.C. to Study if Amazon Warps the Economy, N.Y. Times, February 27, 2020, https://nyti.ms/3haPvWl.
[17] See, e.g., Valentina Pop & Sam Schechner, Amazon to Face Antitrust Charges From EU Over Treatment of Third-Party Sellers, Wall St. J. (June 11, 2020), https://www.wsj.com/articles/amazon-to-face-antitrust-charges-from-eu-over-treatment-of-third-party-sellers-11591871818?st=f2dla774u2blkl1.
[18] See, e.g., Lina Khan, Amazon’s Antitrust Paradox, 126 Yale L.J. 710, 743 (2017).
[19] See, e.g., Lauren Hirsch & Megan Graham, States Are Leaning Toward a Push to Break up Google’s Ad Tech Business, CNBC (June 5, 2020), https://www.cnbc.com/2020/06/05/states-lean-toward-pushing-to-break-up-googles-ad-tech-business.html.
[20] See, e.g., Cecilia Kang & Adam Satariano, Regulators Around the World Are Circling Facebook, N.Y. Times (Apr. 25, 2019), https://nyti.ms/2ZcJfaf.
[21] See, e.g., Marshall Steinbaum & Maurice E. Stucke, The Effective Competition Standard: A New Standard for Antitrust, 87 U. Chi. L. Rev. 595 (2019).
[22] As noted earlier, increasing concentration could be consistent with increased competition and improved consumer welfare. Autor, et al., supra note 7. By saying these concerns hinge on increasing concentration, I am suggesting that increasing concentration is a necessary (although not sufficient) element of the concerns discussed here.
[23] See eMarketer, Amazon Remains the Undisputed No. 1 (Mar. 11, 2020), https://www.emarketer.
com/content/amazon-remains-the-undisputed-no-1.
[24] Andrew Lipsman, Top 10 US Ecommerce Companies 2020 Walmart and Target Climb Rankings on Click-and-Collect Gains (2020), https://www.emarketer.com/content/top-10-us-ecommerce-companies-2020.
[25] CNBC. CNBC All-America Economic Survey, Dec, 2018 [survey question]. 31117461.00038. Hart Research Associates/Public Opinion Strategies [producer]. Cornell University, Ithaca, NY: Roper Center for Public Opinion Research, iPOLL [distributor], accessed Jul-24-2020.
[26] Amazon.com, Inc., Annual Report (Form 10-K) (Jan. 31, 2020), https://www.sec.gov/ix?doc=
/Archives/edgar/data/1018724/000101872420000004/amzn-20191231x10k.htm.
[27] Amazon’s financial statements do not include figures for the net sales by third parties on Amazon. In a letter to Amazon shareholders, Jeff Bezos suggested that third party sales accounted for a little less than 60% of total net sales in 2018. Jeff Bezos, 2018 Letter Shareholders (2020), https://www.sec.gov
/Archives/edgar/data/1018724/000119312519103013/d727605dex991.htm.
[28] See Walmart Inc., Annual Report (Form 10-K) (Jan. 31, 2020).
[29] See Lipsman, supra note 24.
[30] See Melissa Repko, Walmart Steps up Competition with Amazon by Fulfilling Orders for Third-Party Vendors, CNBC (Feb. 25, 2020), https://www.cnbc.com/2020/02/25/walmart-wants-to-make-it-easier-for-third-party-vendors.html.
[31] Brian Baugh, Itzhak Ben-David & Hoonsuk Park, Can Taxes Shape an Industry? Evidence from the
Implementation of the ‘Amazon Tax’, 73 J. Fin. 1819 (2018).
[32] Hart Research Associates/Public Opinion Strategies, CNBC AAES Fourth Quarter Survey 12 (Nov./Dec. 2015), https://www.scribd.com/doc/292784115/CNBC-All-America-Economic-Survey-results-December-9-2015.
[33] Yu Jeffrey Hu & Zhulei Tang, The Impact of Sales Tax on Internet and Catalog Sales: Evidence from a
Natural Experiment, 32 Int’l J. Indus. Org. 84 (2014).
[34] If data were available, there is potentially even more variation to exploit in this experiment to the extent that same-day delivery was not available for every product.
[35] Of course, the intuition presented here makes the ceteris paribus assumption regarding the relative price (net of shipping) and quality of the Amazon and other retailers’ goods before and after the policy change. In practice, the researcher would need to account for possible changes.
[36] See, e.g., Warren Shoulberg, It’s Alibaba, Not Walmart, That Amazon Should Really Be Worried About, Forbes (June 15, 2020), https://www.forbes.com/sites/warrenshoulberg/2020/06/15/its-alibaba-not-walmart-that-amazon-should-be-really-worried-about/#65484ee07ddc.
[37] See, e.g., Gilad Edelman, Amazon Doesn’t Favor Its Own Brands—Except When It Does, Wired (Nov. 24, 2019), https://www.wired.com/story/amazon-gating-private-labels-antitrust/.
[38] Philippon, supra note 3, at 34.
[39] Id. at 33.
[40] Id. at 32.
[41] Id. at 39.
[42] U.S. Bureau of Economic Analysis, Personal Consumption Expenditures, https://fred.stlouisfed.
org/series/PCE.
[43] U.S. Census Bureau, Estimates of Monthly Retail and Food Services Sales by Kind of Business: 2020, https://www.census.gov/retail/mrts/www/mrtssales92-present.xls.
[44] Given the limited number of observations, it is not sensible to formally test equality of these trends in a statistical sense.
[45] Philippon, supra note 3, at 40.
[46] While many Walmarts are open 24 hours per day, seven days per week, not all are. See, e.g., Kelly Tyko, Walmart Cuts Hours at 24-Hour Stores and Other Locations Nationwide Starting Sunday Due to Coronavirus, USA Today (Mar. 14, 2020), https://www.usatoday.com/story/money/2020/03/14/coronavirus-walmart-store-hours-retailer-temporary-change/5052603002/.
[47] See, e.g., Derek Thompson, Amazon’s Pivot to Poor People: Amazon Wants To Become Walmart Faster than Walmart Can Become Amazon, The Atlantic (June 6, 2017), https://www.theatlantic.com/
business/archive/2017/06/amazons-pivot-to-poor-people/529383/.
[48] While using sector-specific price indexes would provide even better indications of consumption quantity, I continue to use the PCE index for continuity’s sake. Using sector-specific deflators yields comparable trends.
[49] See Philippon, supra note 3, at 5-10.
[50] Id. at 9.
[51] Cable.co.uk, The Cost of Fixed-Line Broadband in 206 Countries, https://www.cable.co.uk
/broadband/pricing/worldwide-comparison/.
[52] OECD, Fixed Broadband Subscriptions Per 100 Inhabitants, Per Speed Tiers (Dec. 2019), https://www.oecd.org
/sti/broadband/5.1-FixedBB-SpeedTiers-2019-12.xls.
[53] Akamai, State of the Internet Q1 2017 Report (2017), https://www.akamai.
com/fr/fr/multimedia/documents/state-of-the-internet/q1-2017-state-of-the-internet-connectivity-report.pdf.
[54] Bhaskar Chakravorti, Ajay Bhalla & Ravi Shankar Chaturvedi, Which Countries Are Leading the Data Economy? Harv. Bus. Rev. (Jan. 24, 2019), https://hbr.org/2019/01/which-countries-are-leading-the-data-economy.
[55] Philippon, supra note 3, 140-141.
[56] Id. at 142-143.
[57] OECD, Historical Fixed Broadband Subscriptions Per 100 Inhabitants, https://www.oecd.org/sti/
broadband/1.5-BBPenetrationHistorical-Data-2019-12.xls.
[58] OECD, Measuring the Digital Transformation: A Roadmap for the Future 101 (2019).
[59] Multiplying the average data used per month per subscriber by the average number of subscriptions per resident yields a per resident data usage figure.
[60] Philippon, supra note 3, at 37.
[61] Id. at 7.
[62] Int’l Air Transp. Assoc., World Air Transport Statistics 5 (2019) [hereinafter IATA], https://www
.iata.org/contentassets/a686ff624550453e8bf0c9b3f7f0ab26/wats-2019-mediakit.pdf.
[63] The U.S.’s measure of total distance flown is likewise tops in the world. See IATA, supra note 62, at 18.
[64] Id. at 31-33.
[65] Id. at 19-20.
[66] See, e.g., StatCounter, Search Engine Market Share Worldwide, https://gs.statcounter.com/search-engine-market-share which indicated google accounted for almost 92% of worldwide internet searches in June 2020.
[67] NPR/Marist, Poll Results June 2018: Digital Economy 13 (2018), http://maristpoll.marist.edu/wp-content/misc/usapolls/us180423_NPR/NPR_Marist%20Poll_Tables%20of%20Questions_ May%202018.pdf#page=2.
[68] See, e.g., Greg Magana, Amazon Rules the Product Search Process, Bus. Insider (Mar. 20, 2019), https://www.businessinsider.com/online-shoppers-rely-heavily-on-amazon-2019-3.
[69] Associated Press/MTV. MTV/AP-NORC Youth Political Pulse Survey, Sep, 2018 [survey question]. 31115630.00018. AP-NORC Center for Public Affairs Research [producer]. Cornell University, Ithaca, NY: Roper Center for Public Opinion Research, iPOLL [distributor], accessed Jul-25-2020.
[70] Pew Research Center for the People & the Press. Pew Research Center for the People & the Press Poll, Feb, 2018 [survey question]. 31115098.00065. GfK Knowledge Networks [producer]. Cornell University, Ithaca, NY: Roper Center for Public Opinion Research, iPOLL [distributor], accessed Jul-25-2020.
[71] Press Release, European Comm’n, Antitrust: Commission Fines Google €2.42 Billion for Abusing Dominance as Search Engine by Giving Illegal Advantage to Own Comparison Shopping Service (June 27, 2017), https://ec.europa.eu/commission/presscorner/detail/en/IP_17_1784.
[72] Press Release, European Comm’n, Antitrust: Commission Fines Google €1.49 Billion for Abusive Practices in Online Advertising (Mar. 20, 2019), https://ec.europa.eu/commission/presscorner/detail/en/IP_19_1770.
[73] See Datanyze, Market Share Category: Web Conferencing, https://www.datanyze.com/market-share/web-conferencing–52.
[74] See, e.g., Steinbaum & Stucke, supra note 21.
[75] See, e.g., David Dayen, Fiona, Apple, and Amazon: How Big Tech Pays to Win the Battle of Ideas, The American Prospect (July 20, 2020), https://prospect.org/power/fiona-apple-amazon-how-big-tech-pays-to-win-battle-ideas/; Daisuke Wakabayashi, Big Tech Funds a Think Tank Pushing for Fewer Rules. For Big Tech. N.Y. Times (July 24, 2020), https://www.nytimes.com/2020/07/24/technology/global-antitrust-institute-google-amazon-qualcomm.html.
[76] See, e.g., Philippon, supra note 3, at 153-206.
[77] See, e.g., Khan, supra note 18, at 739-44; Matt Stoller, Goliath: The 100-Year War Between Monopoly Power and Democracy (2019).
[78] See, e.g., Joshua Wright, Elyse Dorsey, Jonathan Klick & Jan M. Rybnicek, Requiem for a Paradox: The Dubious Rise and Inevitable Fall of Hipster Antitrust, 51 Ariz. St. L.J. 293 (2019).