Introduction
“You can see the computer age everywhere but in the productivity statistics.”
-Robert Solow (1987)[1]
Despite rapid development in information technologies in the 1970s and 1980s, productivity in the US was slowing down. A key reason for this productivity paradox was that investments in information technologies require complementary investments in business processes and productivity gains, which usually lag behind information technologies.[2] A similar debate has happened over the past decade as productivity in the US and other advanced economies has fallen while there has been more and more technology around us. Companies in Silicon Valley believe that this is due to a mismeasurement in productivity.[3] However, a recent analysis has shown that mismeasurement in information technology alone cannot explain this productivity slowdown.[4]
A more fundamental question related to the current digital economy is whether digitization has increased consumer welfare. Traditionally economists and policymakers have used changes in Gross Domestic Product (GDP), and measures derived from GDP such as productivity, as proxies for changes in consumer welfare and well-being. However, this relationship might not be accurate in the current digital age where most of the digital goods that we consume online have a price of zero.
The average US resident spent around 6.3 hours a day on digital media in 2018.[5] This increased from 2.7 hours a day in 2008 and is expected to grow at 5% year over year in the coming years. Most of this time is now spent on apps on mobile devices and most of these apps (over 90%) are free to consumers. Therefore, as consumers consume more and more free digital goods, their welfare should increase. However, if we look at the share of the information sector, as a percentage of GDP, it has remained at around 4-5% for the last 40 years (Figure 1). Clearly technology plays a much bigger role in our lives today than it did 40 years ago. This points to the need for measuring the welfare contributions of digitization rather than inferring them from measures of production.
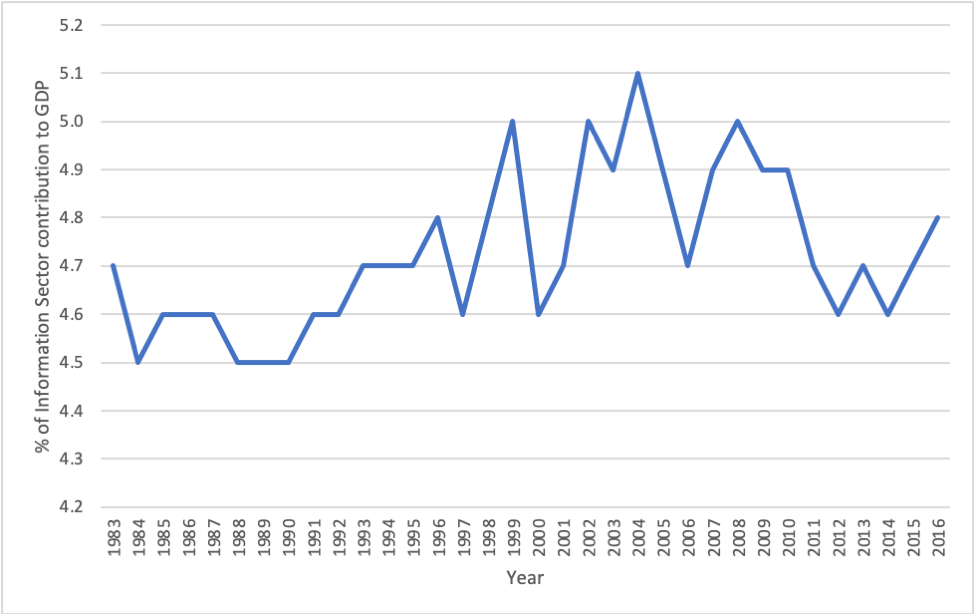
Figure 1 Contribution of information sector to GDP in the US (source: BEA)
William Nordhaus found that firms were only able to capture a tiny fraction (3–4%) of the total social returns to technological innovations.[6] The remaining 96–97% of the returns went to consumers. It is challenging for firms to capture more returns from zero marginal cost digital goods when the competitive price in equilibrium is zero. Therefore, measures of production capture only a small fraction of the total gains from digitization, and it is important to measure welfare gains enjoyed by consumers.
A smartphone today has substituted for several devices purchased by consumers in the past, including: cameras, alarm clocks, music players, calculators, computers, navigation devices, land line telephones, game machines, video players, recording devices, and video cameras. In addition, a smartphone has new apps and features such as search engines, social media, and instant messaging which did not exist before. On one hand, almost all of these apps and features are available for free and the price of a smartphone has not fallen significantly compared to the price of feature phones before smartphones were introduced. On the other hand, people used to pay several thousand dollars combined to purchase these devices in the past. One estimate puts the total cost of some of these substituted devices at over $5,000.[7] Therefore, as a result of these innovations, the contribution of the information technology sector to GDP and productivity could fall while consumer welfare increases.
Section 1 explores the relationship between GDP and consumer welfare with examples of cases when they are correlated and when they are not. Section 2 provides a summary of the literature measuring the consumer welfare derived from various digital goods. Section 3 explores recent research measuring consumer welfare using massive online choice experiments and Section 4 discusses incorporating these estimates into a macroeconomic welfare indicator. Section 5 summarizes research on the impact of digitization on subjective well-being and Section 6 concludes the chapter with a proposal for a dashboard of welfare metrics for the current digital age.
I. GDP and Consumer Surplus in the Digital Economy
Consumer surplus or welfare is defined as the difference between the value obtained by a consumer by consuming a good and the price paid to purchase that good (Triangle A in Figure 2). Consumer surplus is meant to quantify the economic wellbeing of a consumer from consuming a good. Producer surplus refers to revenues generated by a firm from selling a good (Rectangle B in Figure 2). Producer surplus of final goods would show up in the GDP of an economy.
The relationships among GDP and consumer surplus can be understood by looking at three types of goods.[8] First, consider most of the classic physical goods of the 20th century (e.g. cars, books, cassette tapes, etc.): consumer surplus is proportional to firm revenue (Figure 2). Keeping the supply curve fixed, as more consumers enter the market, the size of the market increases, and the demand curve shifts to the right. Therefore, both consumer surplus and producer surplus increase approximately proportionately. The increased producer surplus shows up in GDP statistics, and hence both GDP and consumer welfare move in the same direction. Keeping price fixed, doubling the number of goods sold roughly doubles the revenues, the contribution to GDP, and consumer surplus.
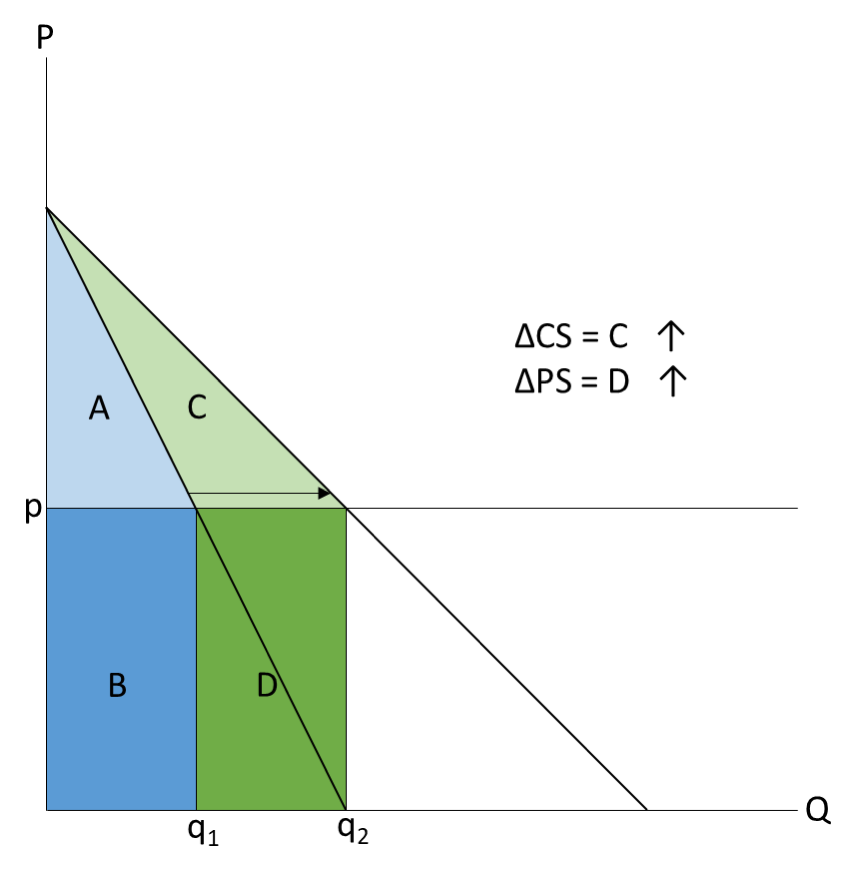
Figure 2 Changes in consumer surplus and producer surplus from a shift in demand curve for classic goods (Brynjolfsson et al., 2019b)
Second, consider purely digital goods such as search engines, digital maps, social media and instant messaging apps, which have essentially zero marginal cost and are typically offered to consumers for free. As consumers consume more and more of these free goods (e.g. doubling their consumption of digital maps), consumer surplus will also increase, but this change in well-being does not necessarily result in changes in producer surplus and GDP (Figure 3).
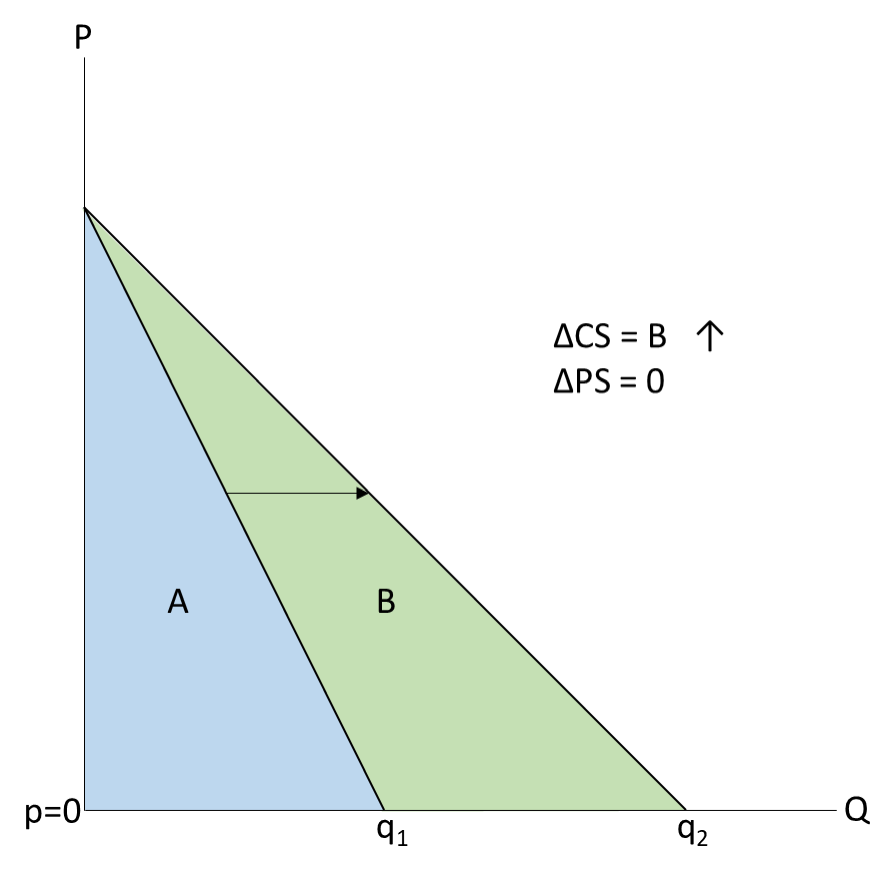
Figure 3 Changes in consumer surplus and producer surplus from a shift in demand curve for digital goods (Brynjolfsson et al., 2019)
Third, consider digital goods which substitute for physical goods and services. Increasingly, digital innovators are disrupting a number of incumbent sectors. A good example of such a transition is the encyclopedia industry. While previously, we used to spend thousands of dollars purchasing every volume of a physical encyclopedia (e.g., Britannica), people now obtain this information for free from Wikipedia. Britannica has stopped printing physical books due to a lack of demand. Wikipedia has an order of magnitude times more articles than Britannica ever had and its quality (accuracy) is comparable for overlapping articles.[9] Wikipedia has no revenues and is entirely built through contributions by volunteers. As a result of this transformation from a paid physical product to a digital good, consumer welfare increases while the contribution of the encyclopedia to GDP would fall. Therefore, consumers are better off, but GDP would go down. Many digital goods that we use currently, such as digital maps, music streaming websites and apps, and news websites have transitioned from physical forms. Not only are changes in GDP and consumer surplus not proportional, but they might also be negatively correlated for such products.
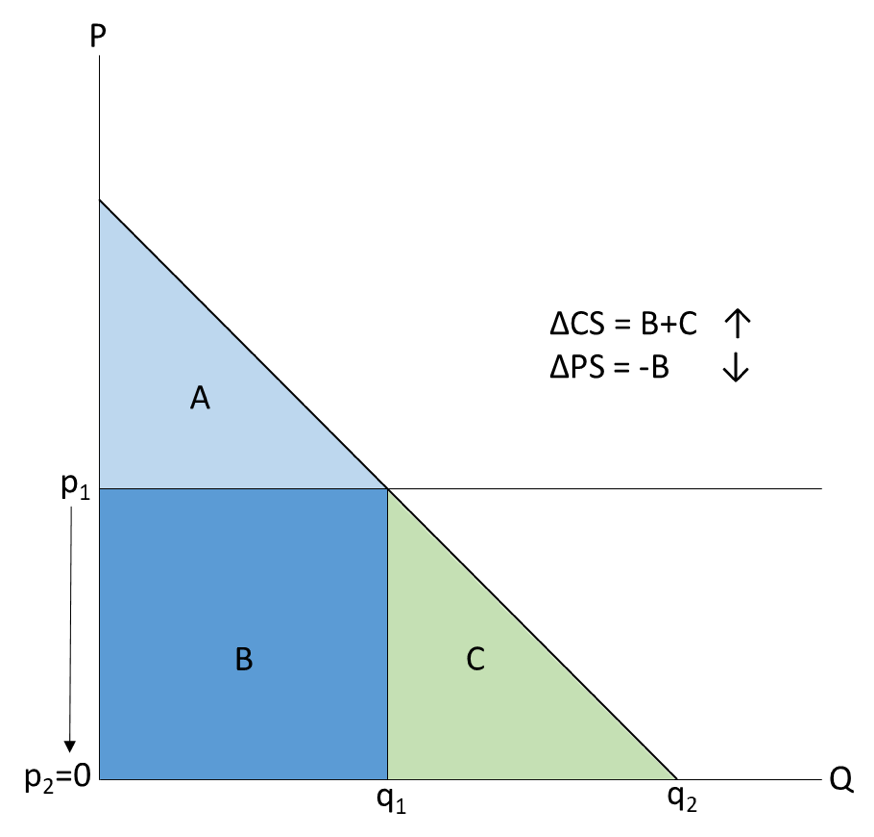
Figure 4 Changes in consumer surplus and producer surplus for goods transitioning from physical to digital (Brynjolfsson et al., 2019)
These examples illustrate the fact that GDP is not a good measure of consumer welfare for purely digital goods and goods transitioning from physical to digital. While the total surplus (consumer surplus + producer surplus) generated by such goods is a measure of societal well-being, the share of the producer surplus is much lower compared to consumer surplus.[10]
Some digital goods, such as Wikipedia, are truly free. However, the business models for most digital goods, such as Google and Facebook, are based on online advertisements. There have been attempts to measure the contribution of free digital goods to productivity by looking at the amount of revenues generated by advertisements. Total advertising revenue as a share of GDP has remained at around 1% for the last 100 years.[11] However, it is important to note that advertising revenues and consumer welfare are often not correlated.[12] Suppose there are two types of consumers who visit an online platform: one values it more and one values it less. The platform shows the same number of advertisements to both of these consumers and earns the same amount of revenues from them. However, the consumer who values the website more obtains much more welfare than the consumer who values the website less. Therefore, it is not sufficient to use advertising revenues of digital goods as a proxy for their contributions to consumer welfare.
II. Previous Research Measuring Consumer Surplus of Digital Goods
Recently, there has been increasing interest from academics in attempting to quantify the consumer surplus of digital goods or the internet as a whole. The early literature on this topic started with measuring consumer surplus from e-commerce, and recent literature has included social media and other free goods.
Brynjolfsson et al. quantify the economic impact of increased variety of products (also known as “the long tail”)[13] on e-commerce platforms using a case study of books sold on Amazon.[14] Previous research shows that a rise in e-commerce led to increased competition for sellers, lower prices for consumers (9–16% lower), and lower menu costs compared to traditional physical retailers.[15] Brynjolfsson et al. found that increased product variety on online bookstores contributed to an increase in consumer surplus of between $731 million and $1.03 billion in the year 2000.[16] This estimate was 7–10 times larger than the consumer surplus gains from increased competition and lower prices.
Austan Goolsbee and Peter Klenow estimate consumer welfare from accessing the internet by looking at the time spent online on various platforms.[17] They assume that the time spent online at home (residential use of internet) is equivalent to time spent not working, i.e., the opportunity cost of spending time online is equivalent to the average wage that could be earned by someone. Such an approach based on time spent could be used to value free digital goods that do not have a positive price associated with them. They found that the consumer welfare gains from using internet at home is around $3000 per person for the median US resident. They also found that a simple calculation using only money spent on internet access would lead to a significant underestimate of consumer welfare (less than $100 per person).
Brynjolfsson and Oh extend the work of Goolsbee and Klenow by building a richer model of demand estimation to account for substitutability across products (e.g., internet and television) and incorporating quality improvements to the internet over time.[18] They found that consumer surplus from free digital goods on the internet was over $159 billion per year from 2007 to 2011. Out of this surplus, around $106 billion per year was due to free digital goods online which amounted to 0.74% of annual GDP in that period. Similar to Goolsbee and Klenow, they found that ignoring the value of time spent on free digital goods would result in a much lower welfare gain of around $4.2 billion per year.[19]
Chen et al. conduct a unique experiment to measure consumer welfare gains from using search engines (e.g., Google).[20] Instead of time spent online, they measure time saved by using search engines over offline alternatives. To do so, they conduct an experiment where they randomly assign participants to find answers to reference questions either online or in a library (offline). They find that the average web search took 7 minutes compared to an average offline search which took 22 minutes. Varian uses these estimates to calculate the consumer surplus from being able to use search engines in the US.[21] Assuming that the time saved on online searches leads to increased time spent earning at work, he finds that Google search generates between $65–$150 billion of consumer surplus across the US per year. This is a significant amount considering that Google only earned around $36 billion in ad revenue per year during that time period.
Greenstein and McDevitt estimate the consumer surplus from access to broadband internet over existing dial up internet using data on pricing and adoption of broadband.[22] They find that the incremental consumer surplus from access to faster broadband internet was around $4.8-$6.7 billion in 2006.
Syverson updates several of these estimates from previous literature for 2015.[23] He estimates incremental consumer surplus from broadband internet over dial up internet for 2015 using the same approach as Greenstein and McDevitt and found consumer surplus to be $17–$26 billion.[24] Using an alternative demand estimation approach followed by Dutz et al., he finds that consumer welfare from broadband internet was $96 billion in 2015.[25] Using the time use approach followed by he finds that consumer surplus from broadband internet was $863 billion in 2015.[26]
Table 1 presents a summary of estimates from selected literature studying consumer surplus from the digital economy. While these papers have computed these estimates using selected case studies and ad hoc approaches, a scalable general approach is needed to estimate consumer surplus from digital goods for a variety of sectors and over time.
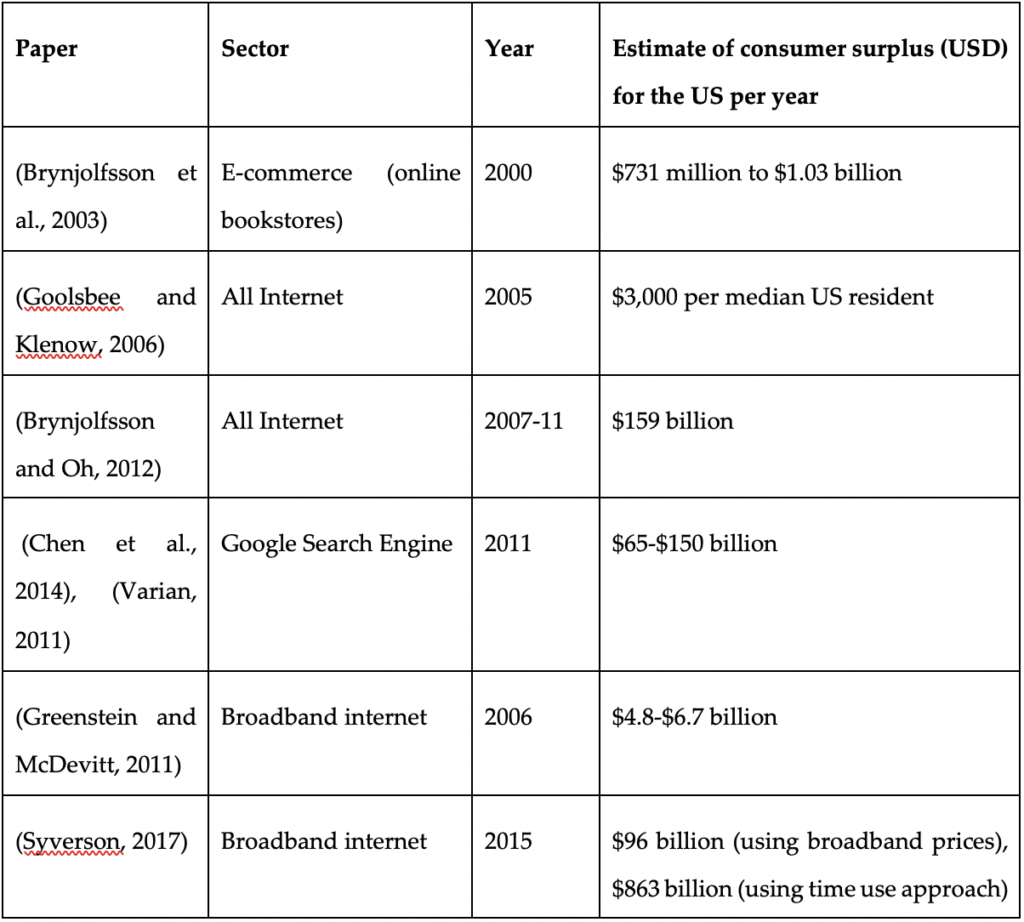
Table 1 Summary of literature estimating consumer surplus of digital goods
III. Measuring Consumer Surplus Using Massive Online Choice Experiments
Consumer welfare from free digital goods cannot be properly inferred from existing macro-economic measures such as GDP and productivity. Brynjolfsson et al. propose a novel way of directly measuring consumer welfare in the digital economy by conducting large-scale online choice experiments.[27] Discrete choice experiments have been widely used in the past to value non-market goods including environmental goods.[28] They have also been used in several legal cases to estimate valuation of features of digital products including smartphones.[29]
(Brynjolfsson et al., 2019b) propose using single binary discrete choice experiments on representative samples of the population to measure valuations of digital goods.[30] These choice experiments ask consumers to make a choice between keeping access to a good that they already use or giving it up for a certain period of time in exchange for monetary compensation. They vary the cash amounts across different groups of consumers and aggregate the responses from thousands of consumers to estimate demand curves. Such an approach could be used for free goods, where the area under the demand curve is an estimate for the consumer surplus generated by a free digital good. These choice experiments can be conducted with real monetary incentives so that responses are consequential and consumers respond truthfully.
Figure 5 shows results from a study measuring valuations of Wikipedia.[31] The X axis shows the percentage of the sample who prefer to reject a cash option and continue to keep access to Wikipedia. The Y axis shows the monetary amounts ($E) offered to the subjects, i.e. the willingness to accept (WTA) to give up Wikipedia for 1 year. As the cash incentives are increased, a larger percentage of the sample chooses to accept the cash and give up access to Wikipedia. The resulting demand curve is a downward sloping log-linear demand curve.
The median US resident values access to Wikipedia for 1 year at $150. This implies that Wikipedia generates around $15 billion in consumer welfare to readers in the US alone, not including the welfare enjoyed by contributors. This is substantial considering that Wikipedia is a truly free good, without any advertisements, and built entirely by volunteers contributing to it for free.
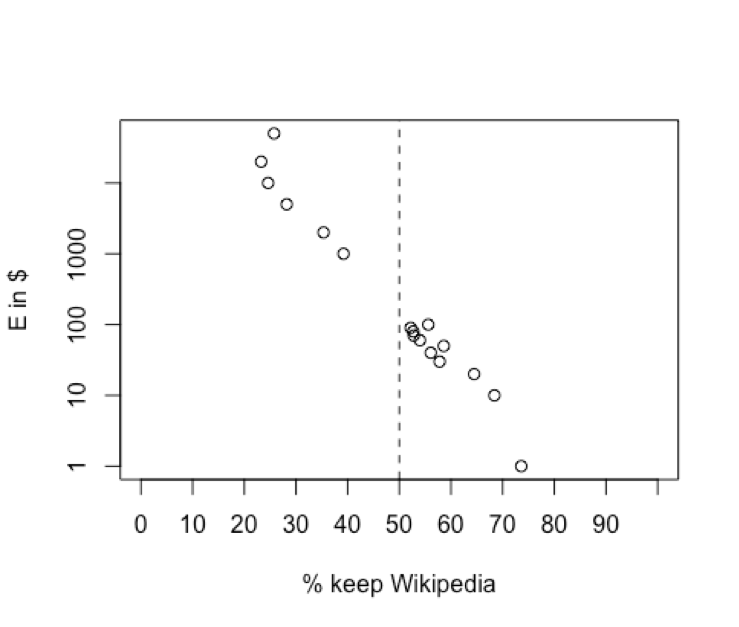
Figure 5 Willingness to accept (WTA) demand curve for giving up access to Wikipedia for 1 year (Brynjolfsson et al., 2018)
Brynjolfsson et al. conduct an incentive compatible single binary discrete choice experiment to measure valuations of Facebook in the US.[32] To do so, they recruit a representative sample of the US internet population and survey them. Some of the respondents are randomly selected and asked to comply with their choices, therefore they are incentivized to reveal truthful responses.
Facebook generated around $48/month of consumer surplus to the median American in 2016. This figure fell to $37 in 2017. Around 20% of the population is willing to give up Facebook for 1 month for as low as $1. Around 20% of the population refuses to give up Facebook for 1 month for $1000. There is a lot of heterogeneity in valuations implying that some groups benefit more than others. For example, women and older people value Facebook more than other demographics. Such an approach could also be used to study substitution across digital platforms. For example, those who use Instagram or YouTube less value Facebook more, implying that Instagram and YouTube are partial substitutes to Facebook.
Allcott et al. conduct a similar experiment to measure the welfare effects of Facebook.[33] In their experiment, they randomize subjects into a control and a treatment group and the treatment group is offered monetary incentives to give up Facebook for 1 month. They measure a variety of outcome variables including economic valuations and subjective well-being scores. They find that the median Facebook user needed $100 to give up Facebook for 1 month. They also find that over 20% of the sample had valuations greater than $500.
These results indicate that social media platforms such as Facebook generate significant consumer welfare. A natural next question to ask is how much of this welfare is due to network effects on these platforms. To explore this, Benzell and Collis conduct a similar choice experiment where they ask subjects to make a choice between giving up specific connections on Facebook and monetary compensation.[34] More specifically, subjects are asked questions about their valuations for giving up friends belonging to a particular age-gender mix.
Figure 6 reports the network of friend values on Facebook for 12 demographic groups (women and men aged 18–65+). The node size is proportional to size of user base and the edges are proportional to the value of the connection. Valuations across the groups range from 4 cents to 65 cents a month (i.e. compensation required for the median consumer to disconnect with a demographic group on Facebook). The values flow to older and female users, similar to the results in Brynjolfsson et al.[35] Benzell and Collis use these valuations to model network effects on Facebook and simulate welfare effects of various regulatory and tax scenarios.[36]
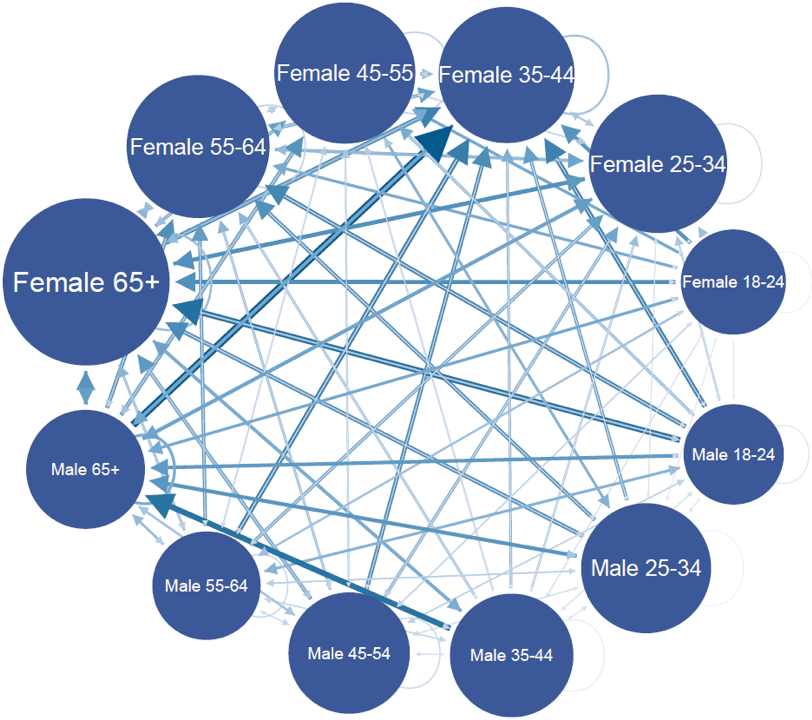
Figure 6 The network of friend values on Facebook (Benzell and Collis, 2020)
Brynjolfsson et al. also measure consumer welfare generated by the most popular digital goods and categories of digital goods in the US and Europe.[37] Figure 7 summarizes these valuations. Search engines generate the most consumer welfare, over $17,000 per year in the US. Search engines are the first stop online for someone searching for information before they navigate to a specific URL. Emails and digital maps are also highly valued by consumers, generating several thousands of dollars in consumer welfare. These categories are followed by video streaming, e-commerce, social media, music streaming, and instant messaging. Recent evidence suggests that these valuations have increased post COVID-19.[38]
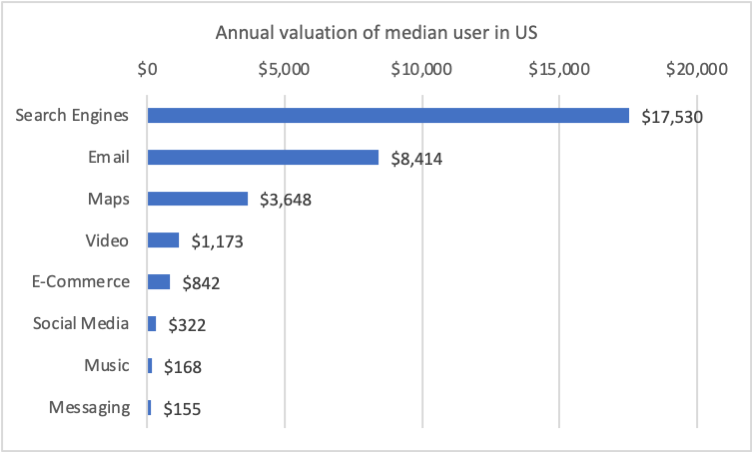
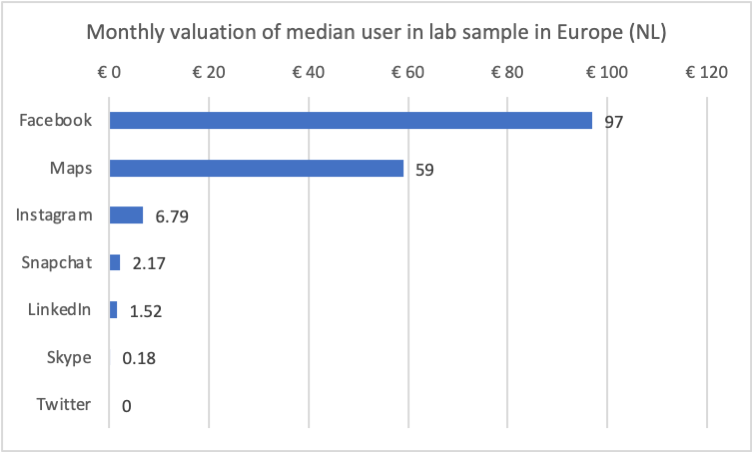
Figure 7 Valuations of popular digital goods and categories of digital goods in US and Europe (Brynjolfsson et al., 2019b)
IV. Creating a New Macroeconomic Welfare Metric Capturing Welfare Gains from Digital Goods
There are two types of goods that characterize the digital economy: free goods and new goods. Most digital goods are free to consumers and rapid innovation means that new digital goods are constantly added to the consumption basket. These features of the digital economy pose challenges to economic measurement. GDP does not properly capture the welfare gains from free goods and new goods.[39]
Brynjolfsson et al. propose a new measure of the economy, GDP-B, which captures the benefits from both new and free goods.[40] The key idea behind their framework is the concept of total income that includes market income and imputed income from consumption of digital goods. This imputed income can be calculated through choice experiments as described in the previous section. Analyzing changes in total income across two years gives us changes in GDP-B.
Facebook was created in 2004. In 2016–17, it generated around $40 in consumer welfare for the median American. Average GDP growth from 2003 to 2017 in the US was 1.83%. Accounting for the benefits of Facebook, GDP-B growth would have been an extra 0.04% per year in that period, or 1.87% per year. Using a similar analysis, WhatsApp has contributed to at least 1% in GDP-B growth in the Netherlands since its inception in 2010.
In addition to free goods, new digital goods are frequently introduced and generate welfare to consumers. Consider the example of cameras on smartphones. Previously, consumers purchased film or digital cameras for photography. Then smartphones came embedded with cameras and people stopped purchasing digital cameras. To estimate this improvement in quality of phones due to the addition of cameras, Brynjolfsson et al. conducted an incentive compatible experiment where they offer real monetary incentives to subjects in the Netherlands to give up access to their smartphone camera.[41] They find that smartphone cameras generate around €68/month in consumer welfare for the median subject in their sample. This is substantial considering that the cost to manufacture a smartphone camera is only $20–$35 (for the lifetime of the smartphone).
Adding the welfare contributions of the most popular categories of digital goods (Figure 7) leads to an estimate of around $32,000 in consumer welfare for the median American in 2017. Assuming that most of the welfare gains from these goods happened since 2010, the digital economy would have added over $1.2 trillion annually in consumer welfare to GDP-B growth since 2010.
V. Impact of Digitization on Subjective Well-Being
Despite evidence showing that digital goods generate substantial consumer welfare, questions are raised about their impact on other non-economic subjective well-being metrics such as happiness and life-satisfaction. Welfare enhancing goods might still cause a reduction in subjective well-being. There is an active debate among academics regarding the impact of social media and screen time on subjective well-being. Current evidence is inconclusive with studies finding both negative and positive associations between social media usage and subjective well-being.
Using a longitudinal survey, Shakya and Christakis find that the use of Facebook is negatively associated with subjective well-being.[42] Burke et al., find that the type of interactions on Facebook impact well-being rather than overall usage of Facebook. More specifically, directed communication between users is associated with increased well-being while passively consuming content is associated with decreased well-being.[43] Matching Facebook data with administrative records, Hobbs et al. find that having a stronger network on Facebook is associated with lower risk of mortality.[44] Using a large scale representative panel data, Orben et al., conduct a specification curve analysis where they run all plausible combinations of analyses and find no association between social media use and well-being.[45] Orben and Przybylski conduct a similar analysis to study the impact of digital technology use and well-being and find a small, economically insignificant, negative association.[46]
Most of this current evidence is correlational and could suffer from reverse causality.[47] Moreover, all of this evidence uses self-reported survey scales of technology use that are weakly correlated with actual usage.[48] To mitigate these issues, Collis and Eggers conduct a randomized controlled trial with University students over the course of an academic year to study the causal impact of social media usage on subjective well-being.[49] Subjects had to install a tracking device on their digital devices; therefore, they could obtain objective measures of technology use. The treatment group had restricted access to social media use for a full academic term. They find a null result on the impact of social media use on academic performance (grades) and subjective well-being (happiness, life satisfaction, and mental health). This shows that digital goods might generate a large amount of consumer welfare, while having no impact on subjective well-being.
Conclusion
Digital goods generate a large amount of consumer welfare but these welfare gains are not properly measured in existing macroeconomic measures. This chapter summarized existing research on measuring consumer welfare from digital goods. Recent research suggests that massive online choice experiments could be used to measure welfare gains from digital goods in a scalable manner. These estimates can be used to construct macro-economic welfare measures such as GDP-B that better reflect the reality in the digital economy. However, digital goods need not contribute to improved subjective well-being.
Brynjolfsson and Collis propose a spectrum of measures that capture all aspects of well-being in the digital economy (Figure 8).[50] On one end, GDP is a very well-developed precise metric of production. On the other end, subjective well-being measures are meant to capture “true” well-being. However, they are subjective by definition and are not suitable by themselves for macroeconomic policymaking.[51] GDP-B captures welfare gains from digital goods. Policymakers are advised to consult a dashboard of metrics containing all of these metrics rather than focusing on a single GDP metric.
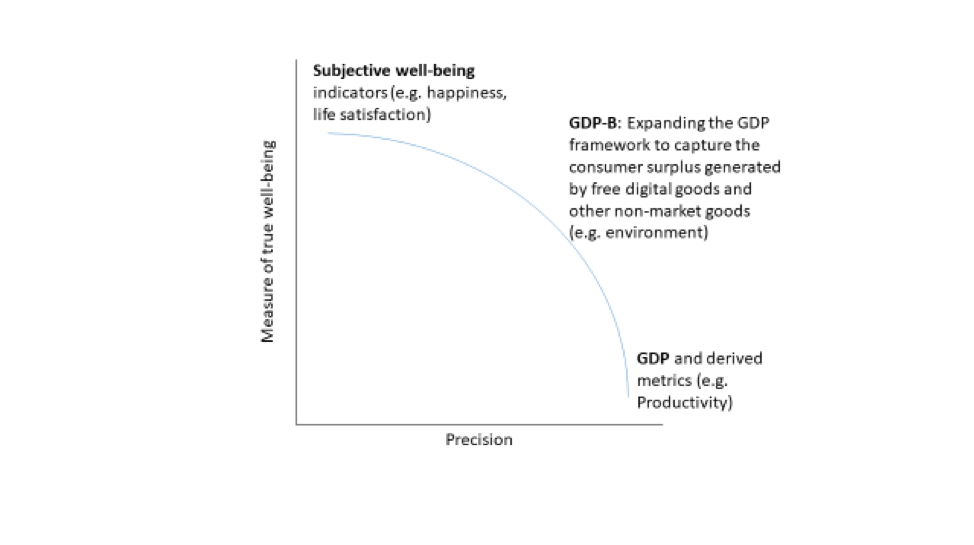
Figure 8 Spectrum of consumer welfare measures in the digital economy
Footnotes
* McCombs School of Business, The University of Texas at Austin. Email: avinash.collis@mccombs.utexas.edu
[1] Robert M. Solow, We’d Better Watch Out, N.Y. Times Book Rev., Jul 12, 1987, at 36.
[2] See Erik Brynjolfsson, The Productivity Paradox of Information Technology, Commc’ns ACM, Dec. 1993, at 67, 75.
[3] See Timothy Aeppel, Silicon Valley Doesn’t Believe US Productivity is Down, Wall St. J. (July 16, 2015), https://www.wsj.com/articles/silicon-valley-doesnt-believe-u-s-productivity-is-down-1437100700.
[4] See Chad Syverson, Challenges to Mismeasurement Explanations for the US Productivity Slowdown, 31 J. Econ. Persps. 165, 167–68 (2017).
[5] Mary Meeker, Internet Trends 2019, Bond Cap. (June 11, 2019), https://www.bondcap.com/report/itr19.
[6] William D. Nordhaus, Schumpeterian Profits in the American Economy: Theory and Measurement 22 (Nat’l Bureau of Econ. Rsch., Working Paper No. 10433, 2004).
[7] Steven Cichon, Everything From This 1991 Radio Shack Ad You Can Now Do With Your Phone, HuffPost (Jan. 16, 2014), https://www.huffpost.com/entry/radio-shack-ad_b_4612973.
[8] Erik Brynjolfsson, Avinash Collis, and Felix Eggers, Using Massive Online Choice Experiments to Measure Changes in Well-Being, 116 Procs. Nat’l Acad. Sci. 7250–55.
[9] See Jim Giles, Internet Encyclopaedias Go Head to Head, 438 Nature 900, 900–01 (2005).
[10] See Nordhaus, supra note 6, at 29–34.
[11] See Leonard Nakamura, Jon Samuels & Rachel Soloveichik, Measuring the “Free” Digital Economy Within the GDP and Productivity Accounts 41 (Bureau of Econ. Analysis, Working Paper No. 0146, 2017).
[12] See Michael Spence & Bruce Owen, Television Programming, Monopolistic Competition, and Welfare, 91 Q.J. Econ. 103, 104–05, 122–23 (1977).
[13] See Chris Anderson, The Long Tail: How Endless Choice is Creating Endless Demand (2006).
[14] Erik Brynjolfsson, Michael D. Smith &Yu (Jeffrey) Hu, Consumer Surplus in the Digital Economy: Estimating the Value of Increased Product Variety at Online Booksellers, 49 Mgmt. Sci. 1580 (2003); Anderson, supra note 13.
[15] See Erik Brynjolfsson and Michael D. Smith, Frictionless Commerce? A Comparison of Internet and Conventional Retailers, 46 Mgmt. Sci. 563 (2000).
[16] See Byrnjolfsson et al., supra note 14, at 1592.
[17] See Austan Goolsbee and Peter J. Klenow, Valuing Consumer Products by the Time Spent Using Them: An Application to the Internet, 96 Am. Econ. Rev. 108, 108 (2006).
[18] See Erik Brynjolfsson & Joo Hee Oh, The Attention Economy: Measuring the Value of Free Digital Services on the Internet 5–6 (Oct. 2012) (unpublished manuscript).
[19] Id. at 14–15.
[20] Yan Chen, Grace YoungJoo Jeon & Yong-Mi Kim, A Day Without a Search Engine: An Experimental Study of Online and Offline Searches, 17 Experimental Econ. 512, 512–13 (2014).
[21] Hal Varian, Economic Value of Google 2, http://assets.en.oreilly.com/1/event/57/The%20Economic%
20Impact%20of%20Google%20Presentation.pdf.
[22] See Shane M. Greenstein & Ryan McDevitt, The Broadband Bonus: Estimating Broadband Internet’s Economic Value, 35 Telecomm. Pol’y 617, 618 (2011).
[23] See Syverson, supra note 4, at 174–75 (citing Shane Greenstein & Ryan C. McDevitt, The Broadband Bonus: Accounting for Broadband Internet’s Impact on U.S. GDP (Nat’l Bureau of Econ. Rsch., Working Paper No. 14758, 2009)).
[24] Id. at 175.
[25] Id. (citing Mark Dutz, Jonathan M Orszag & Robert Willig, The Substantial Consumer Benefits of Broadband Connectivity for US Households, Internet Innovation Alliance, (2009), https://techliberation.com/wp-content/uploads/2010/05/CONSUMER_BENEFITS_OF_BROADBAND.pdf).
[26] Id. at 175–77 (citing Goolsbee & Klenow, supra, note 17).
[27] See Brynjolfsson et al., supra note 8, at 7252.
[28] See, e.g., Richard C. Bishop et. al., Putting a Value on Injuries to Natural Assets: The BP Oil Spill, 356 Sci 253, 253–54 (2017) (conducting such a valuation of injury to the environment after a large oil spill).
[29] See, e.g., Apple Inc. v. Samsung Elecs. Co., 839 F.3d 1034 (Fed. Cir. 2016).
[30] See Brynjolfsson et al., supra note 8, at 7250.
[31] See Erik Brynjolfsson, Felix Eggers & Avinash Gannamaneni, Measuring Welfare with Massive Online Choice Experiments: A Brief Introduction, 108 AEA Papers &Procs. 473, 475 (2018).
[32] See Brynjolfsson et al., supra note 8, at 7251.
[33] Hunt Allcott et al., The Welfare Effects of Social Media, 110 Am. Econ. Rev. 629, 629–30 (2020).
[34] Seth Benzell and Avinash Collis, How to Govern Facebook: A Structural Model for Taxing and Regulating Big Tech 3 (Aug. 10, 2020) (unpublished manuscript), https://ssrn.com/abstract=3619535.
[35] Compare id. at 20–22 (describing findings demonstrating higher surplus for older and female users) with Brynjolfsson et al., supra note 8, at 7252 (noting same).
[36] See Benzell et al., supra note 34, at 26–28.
[37] See Brynjolfsson et al., supra note 8, at 7252.
[38] Diane Coyle & David Nguyen, The Impact of Covid-19 on the Value of Online Goods, VoxEU (July 10, 2020), https://voxeu.org/article/impact-covid-19-value-online-goods.
[39] Sir Charles Bean, Independent Review of UK Economic Statistics: Final Report 19–20 (2016), https://www.gov.uk/government/publications/independent-review-of-uk-economic-statistics-final-report.
[40] Erik Brynjolfsson et al., GDP-B: Accounting for the Value of New and Free Goods in the Digital Economy 3–4 (Nat’l Bureau of Econ. Rsch., Working Paper No. 25695, 2019).
[41] Id. at 42–45.
[42] Holly B Shakya & Nicholas A Christakis, Association of Facebook Use with Compromised Well-Being: A Longitudinal Study, 185 Am. J. Epidemiology 203, 203 (2017).
[43] See Moira Burke, Cameron Marlow & Thomas Lento, Social Network Activity and Social Well-Being, in Ass’n for Computing Machinery, Proceedings of the SIGCHI Conference on Human Factors in Computing Systems 1909, 1909 (2010), https://doi.org/10.1145/1753326.1753613.
[44] William R. Hobbs et al., Online Social Integration is Associated with Reduced Mortality Risk, 113 Procs. Nat’l Acad. Sci.12980, 12980 (2016).
[45] Amy Orben, Tobias Dienlin & Andrew K. Przybylski, Social Media’s Enduring Effect on Adolescent Life Satisfaction, 116 Procs. Nat’l Acad. Sci. 10226, 10226 (2019).
[46] See Amy Orben & Andrew K. Przybylski, The Association Between Adolescent Well-Being and Digital Technology Use, 3 Nature Human Behaviour 173, 173 (2019).
[47] See Orben et al., supra, note 45.
[48] See David A. Ellisa et al., Do Smartphone Usage Scales Predict Behavior?, 130 Int’l J. Hum.-Comput. Stud. 86, 88–90 (2019).
[49] See Avinash Collis & Felix Eggers, Effects of Restricting Social Media Usage (Jan. 14, 2020) (unpublished manuscript), https://ssrn.com/abstract=3518744.
[50] Erik Brynjolfsson & Avinash Collis, How Should We Measure the Digital Economy?, Harv. Bus. Rev. (Nov.–Dec. 2019), https://hbr.org/2019/11/how-should-we-measure-the-digital-economy.
[51] Wouter den Haan et. al., Happiness and Wellbeing as Objectives of Macroeconomic Policy: Views of Economists, VoxEU (Mar. 30, 2017), https://voxeu.org/article/views-happiness-and-wellbeing-objectives-macroeconomic-policy.